



Diagram Maker: Make Diagrams With Professional Design

In MiriCanvas, turn the flow of an idea, a work process, or the relationships between concepts into a diagram that's easy to read. Pick a template you like and fill in your content, and you'll have a diagram that's ready to drop into a report or presentation. Edit the colors, shapes, and connectors freely with just a few clicks.

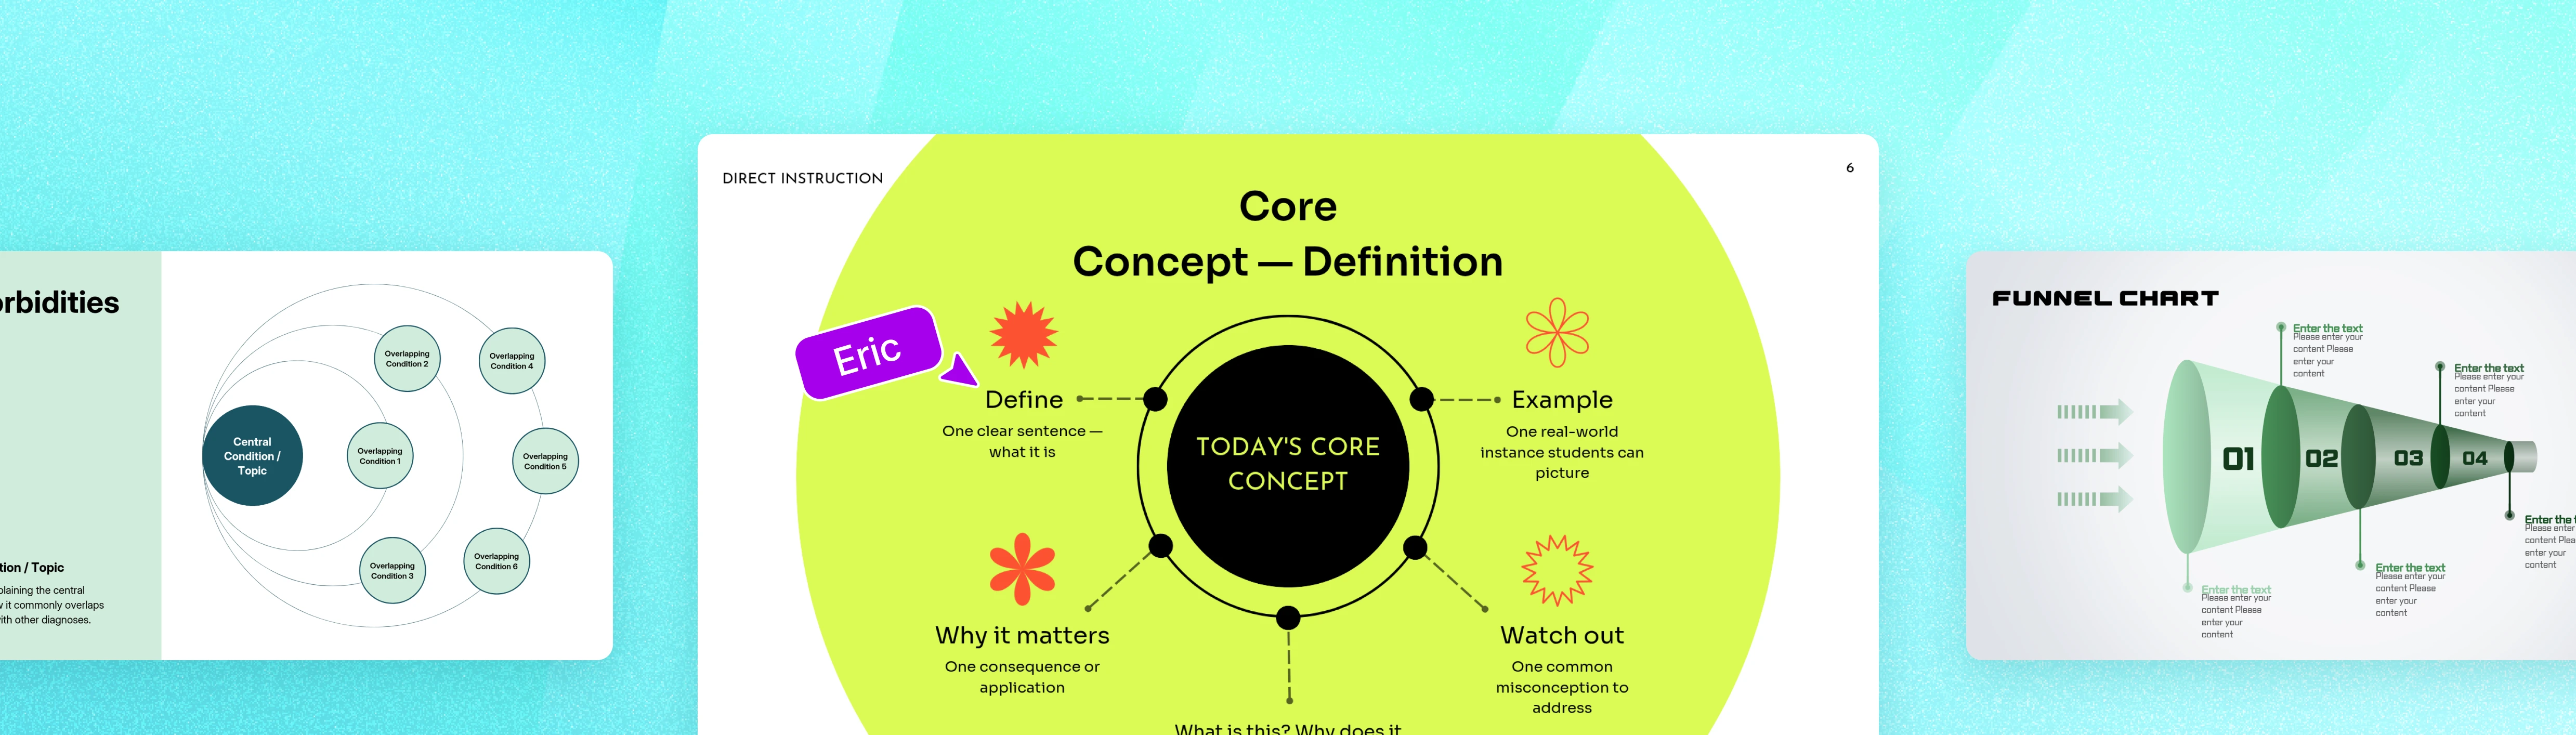
On a teal background, three presentation slides are displayed side by side: a comorbidities diagram with overlapping condition circles around a central topic, a bright green slide titled 'Core Concept — Definition' with a hub-and-spoke diagram connecting Define, Example, Watch out, and Why it matters, and a funnel chart diagram showing four sequential stages labeled 01 through 04.

What You Can Do With the MiriCanvas Diagram Maker

There's no complicated workflow to learn. Handle everything from entering text to editing the design in MiriCanvas, and make your own diagram.

Start Fast With Templates for Many Diagram Types

Get a Polished Look With Expert-Made Templates

Edit Colors, Fonts, and Shapes Item by Item

Drop It Into Any Presentation or Report

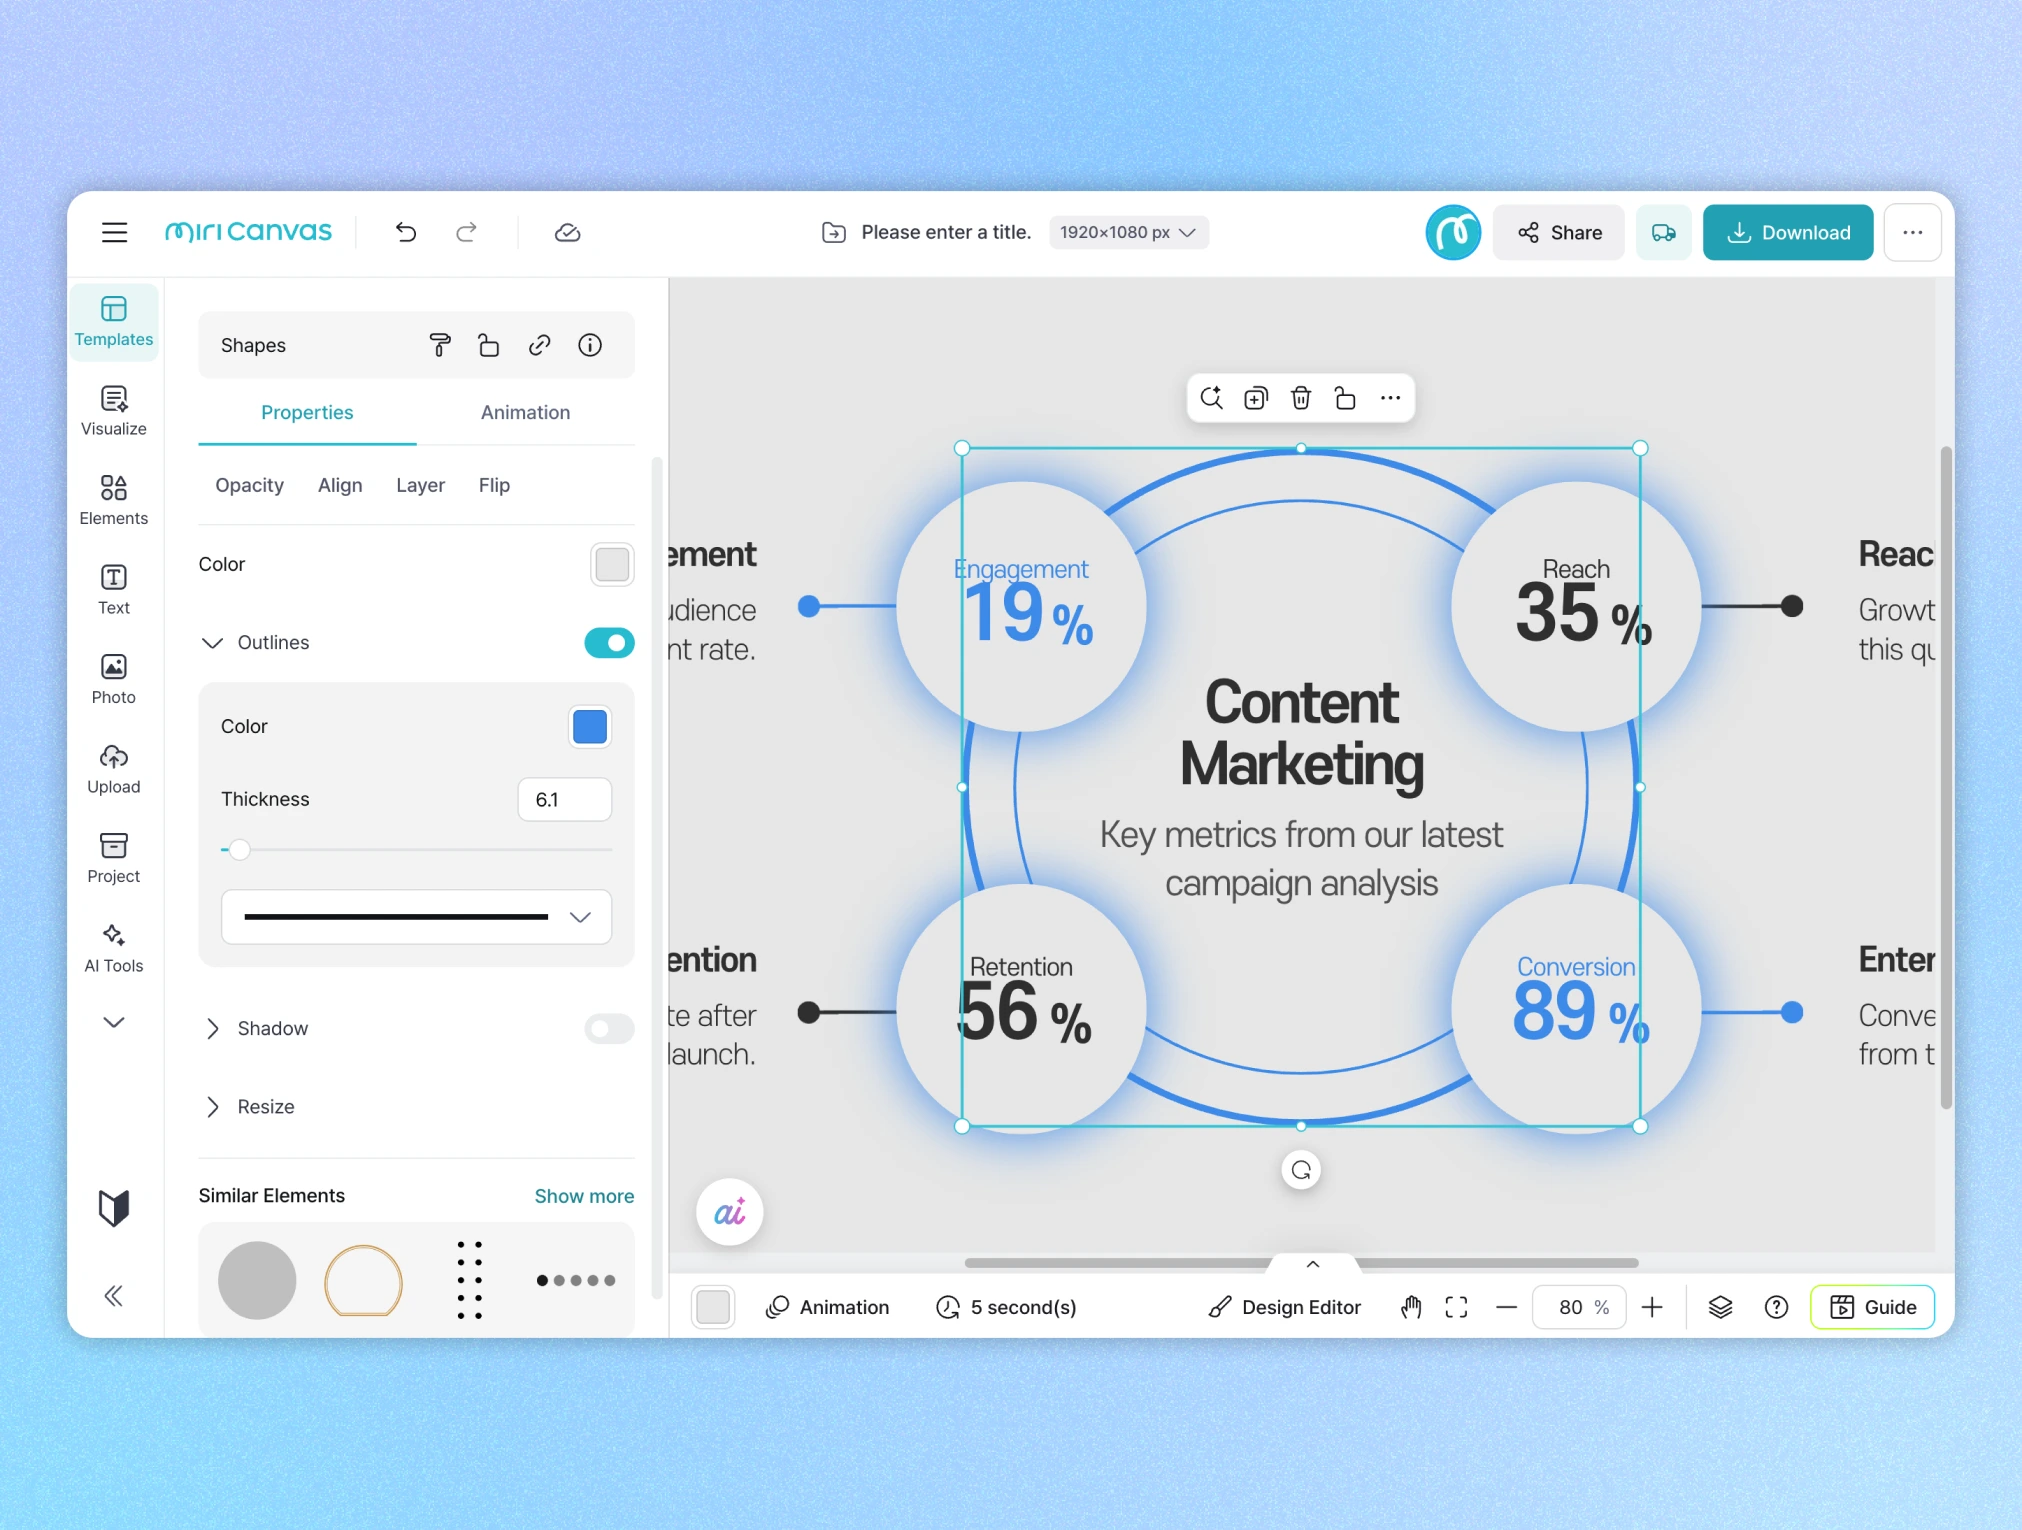
In the Miricanvas editor, a 'Content Marketing' diagram is being edited, showing four circular metrics — Engagement 19%, Reach 35%, Retention 56%, and Conversion 89% — arranged around a central title.

How to Make a Diagram

1

Add a diagram

Start from a template: Open the [Templates] menu on the MiriCanvas site, or search "diagram" or the type you want in the [Templates] menu on the left of the editor. You can start editing right away from a polished design.

Start from a smart object: Select [Smart Object] in the [Chart] menu on the left to add the diagram type you want straight to your canvas.

Start from elements: Place shapes and connectors directly on the canvas from the [Elements] menu on the left to build your structure freely.
2

Choose a diagram design

If you started from [Templates], narrow by "Presentation (PPT)" or "Venn diagram" to find the right template faster. If you started from [Smart Object] or [Elements],you can skip this step.

3

Add content and edit the structure

Click the diagram you added to type text right in. Add or adjust connectors to show the relationships between items, and add or remove shapes as needed to refine the structure.

4

Edit the details

In the settings panel on the left, adjust shape colors and borders and connector styles, item by item. You can also fine-tune font style and text size.

5

Download and share

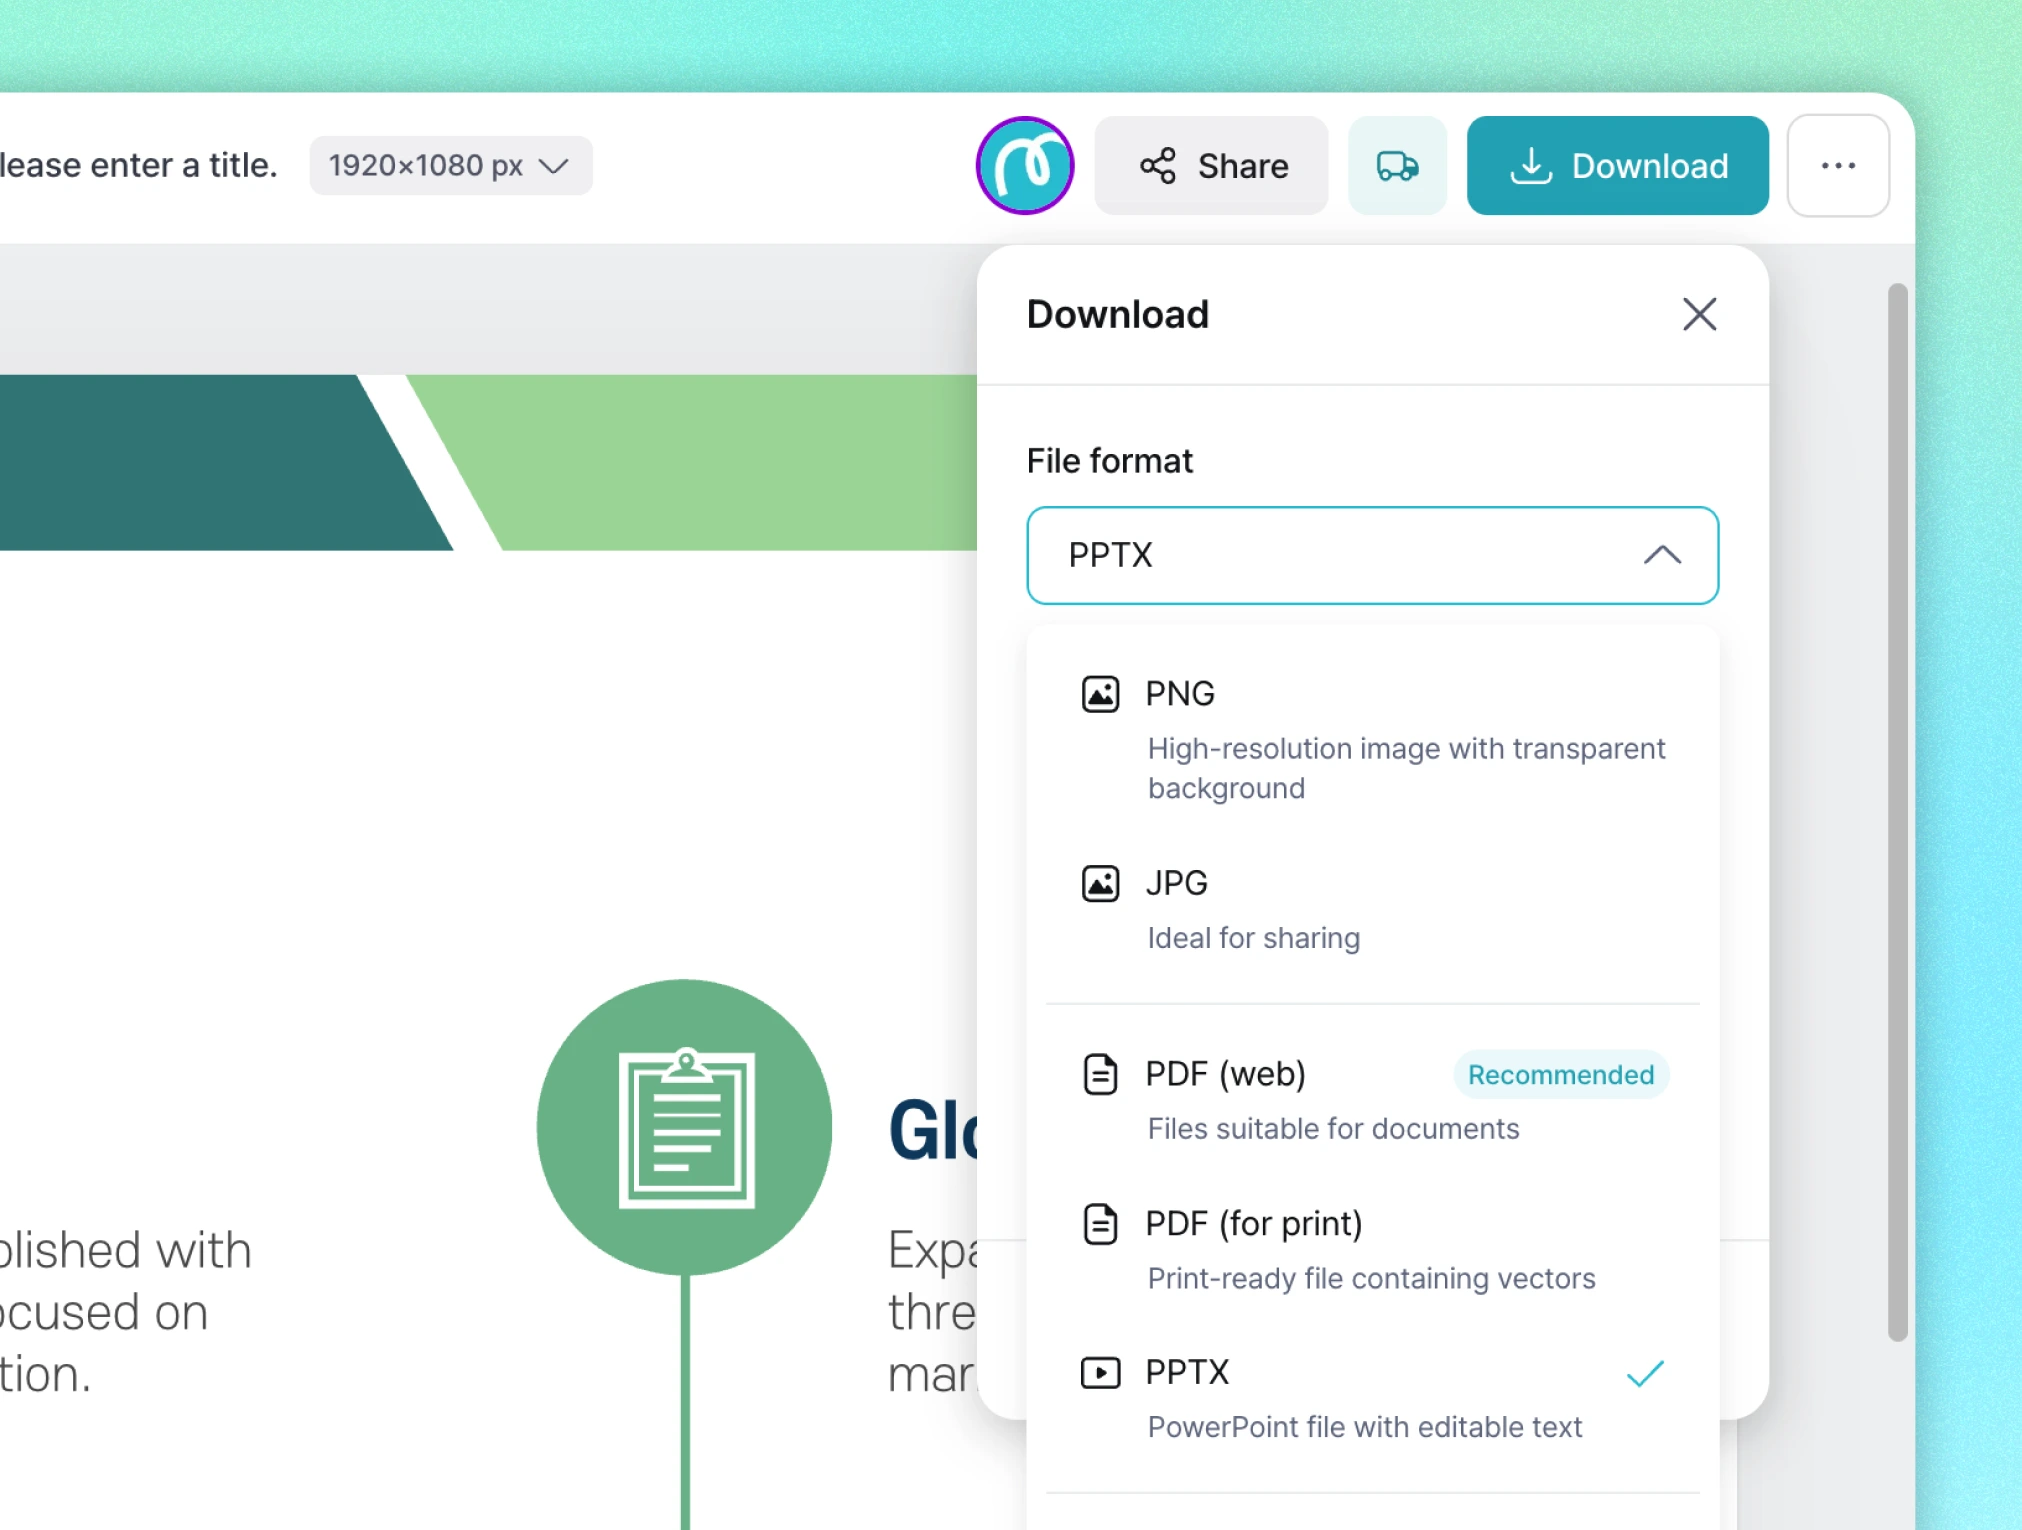
Export your finished diagram as PNG, JPG, PDF, PPTX, and more. Drop it straight into a presentation, or share it with a link.

What Is a Diagram?

A diagram is a visual that uses lines, symbols, and shapes to map the relationships and flow between pieces of information, ideas, or figures.

Text is strong at explaining what something is, but it struggles to show how things connect and where they branch. A diagram turns that structure into a picture and gets it across at a glance.

Structure Complex Content With a Diagram

When a flow is complex or relationships are tangled, text alone can only go so far. The reader has to follow the sentences and assemble the structure in their own head. A diagram shows all those steps, flows, and relationships between items at a glance, so the context comes across without extra explanation.

Add design on top, and you get a diagram that's genuinely easy to read. Just filling in a template and tidying it up is enough to earn trust from your audience. Make your own custom diagram in MiriCanvas.

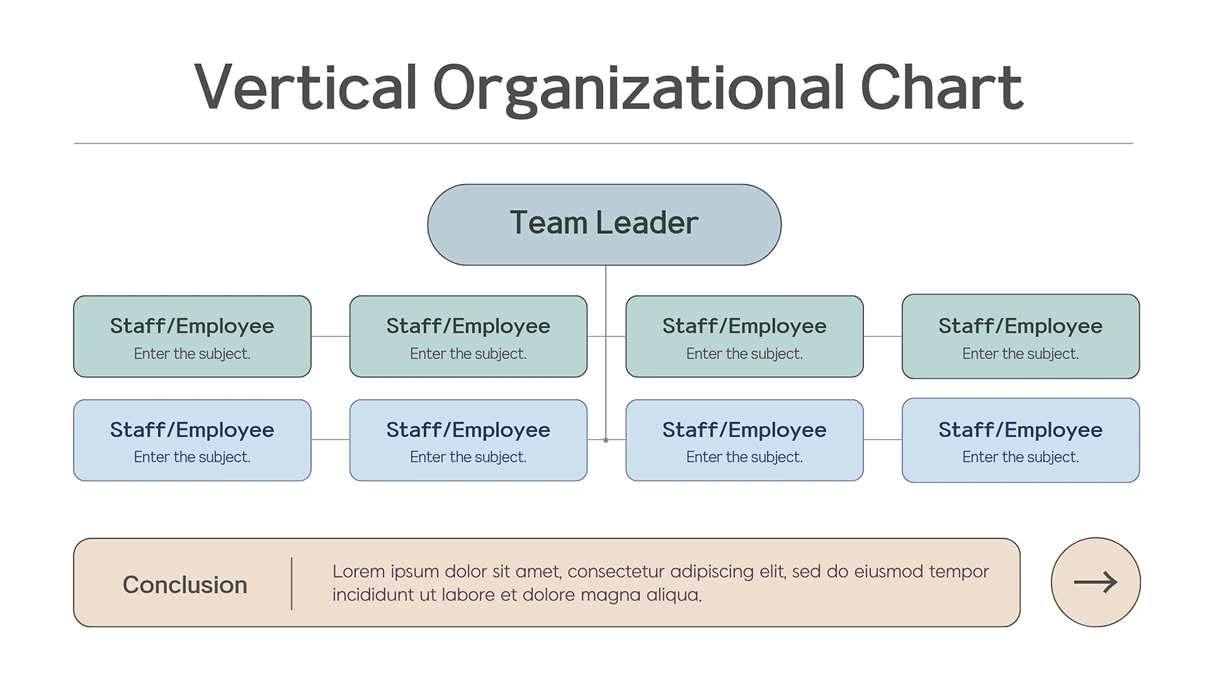
A white slide titled 'Vertical Organizational Chart' shows a hierarchical org chart diagram with a Team Leader at the top branching down into two rows of Staff/Employee boxes, followed by a conclusion box below.
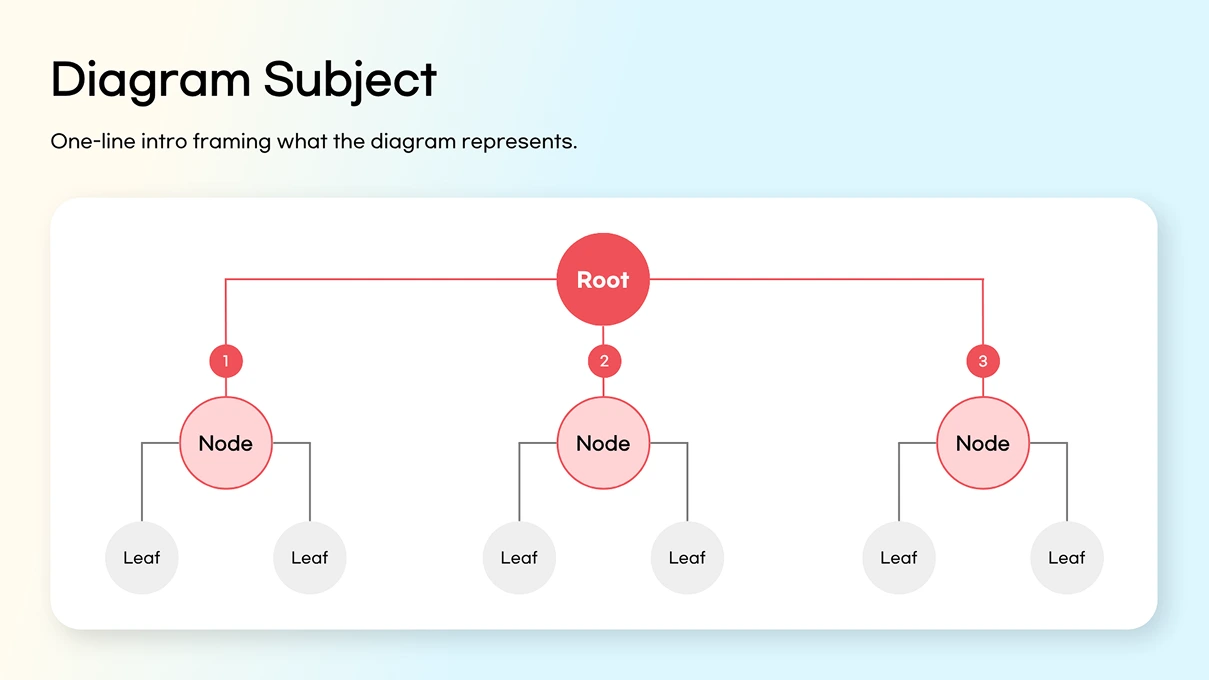
A light blue slide titled 'Diagram Subject' displays a tree diagram with a central Root node branching into three numbered nodes, each further splitting into two leaf nodes.
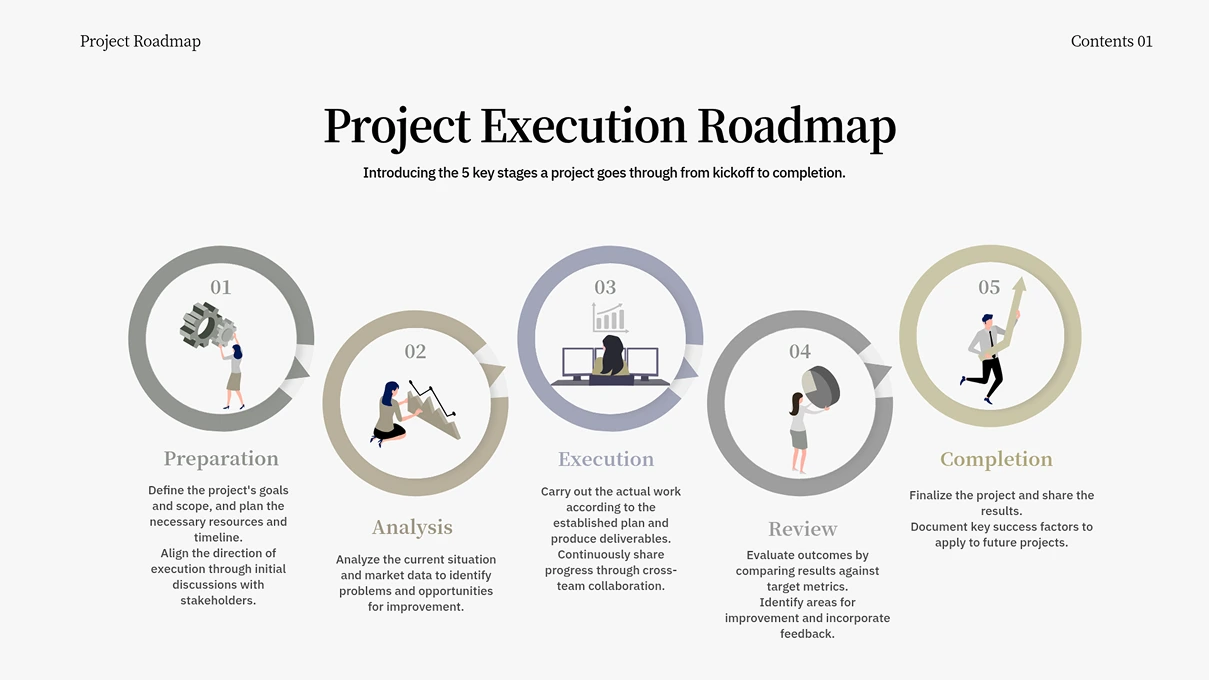
A white slide titled 'Project Execution Roadmap' shows five circular icons labeled Preparation, Analysis, Execution, Review, and Completion, connected in a sequential roadmap diagram.
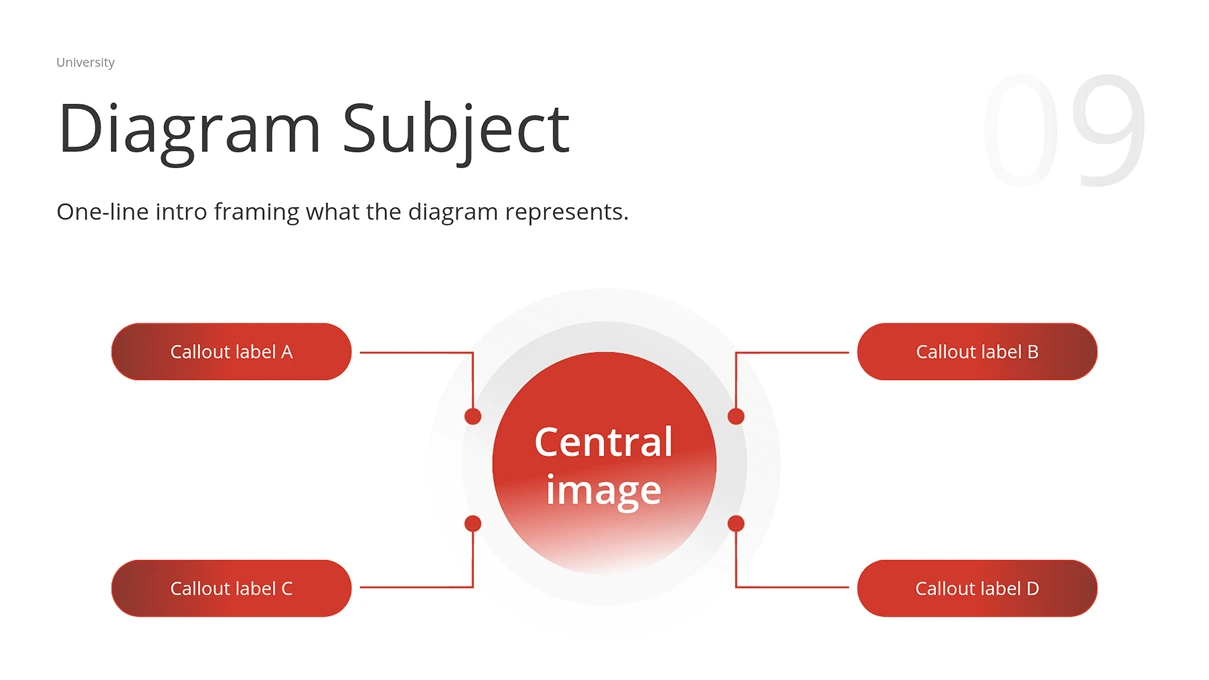
A white slide titled 'Diagram Subject' shows a hub-and-spoke diagram with a central image circle connected to four callout labels positioned around it.
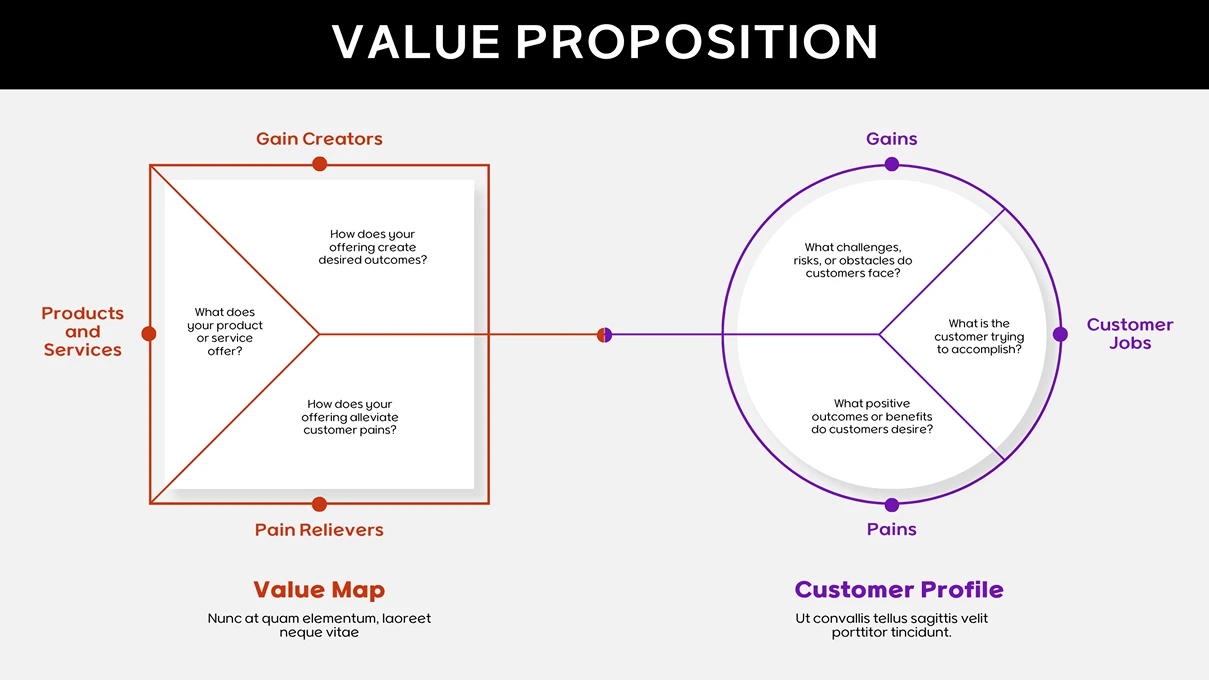
A slide titled 'Value Proposition' displays a value proposition canvas diagram, pairing a square Value Map (Products and Services, Gain Creators, Pain Relievers) with a circular Customer Profile (Customer Jobs, Gains, Pains).
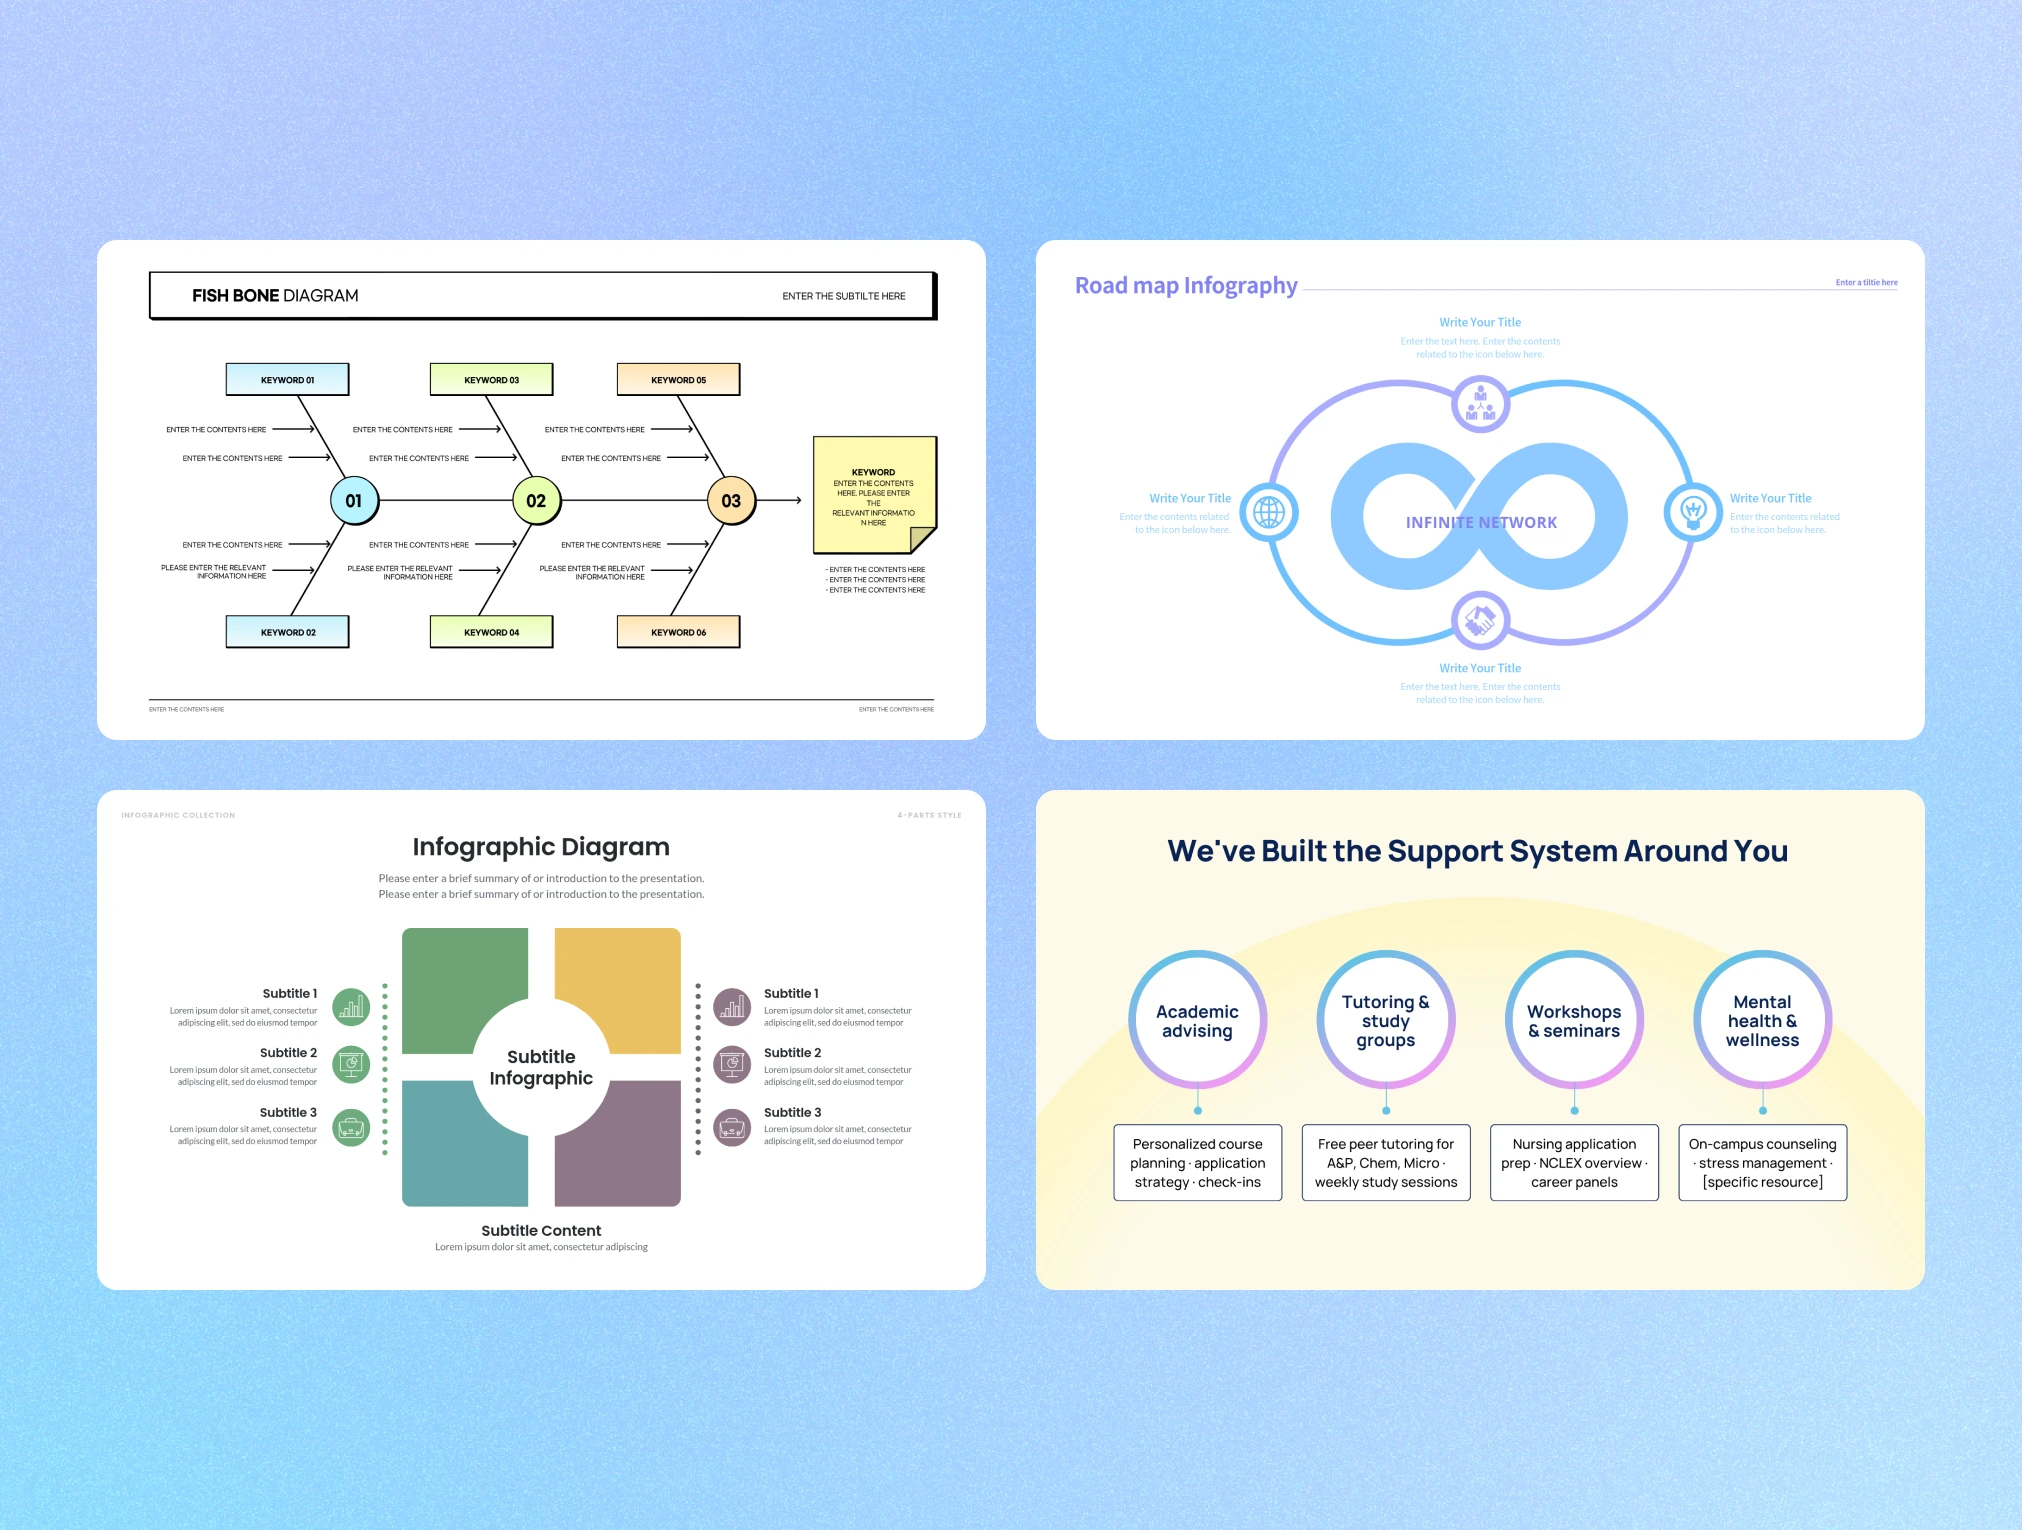
On a light blue-purple background, four presentation slides are arranged in a grid: a fishbone diagram with color-coded keyword branches, a road map infographic featuring an infinite network loop icon, a four-quadrant infographic diagram with a central subtitle circle, and a support system slide showing four circular icons labeled Academic advising, Tutoring & study groups, Workshops & seminars, and Mental health & wellness.

Design Easily With Expert-Made Templates and Elements

You don't have to build from scratch. Pick a diagram template of the type you want and start editing right away. There are templates for reports, presentations (PPT), and other uses too. Want to emphasize a particular structure or flow? Add elements like arrows, shapes, and icons to point straight to what you want people to notice.

Edit Colors, Fonts, and Shapes, Item by Item

Adjust shape colors and borders, connector style and thickness, text placement, and fonts, all item by item. Recoloring a single shape to highlight it, or restyling a connector, takes just a few clicks. There's nothing extra to learn, just select what you want in the settings panel.

In the Miricanvas editor, a download popup is open with a file format dropdown showing options including PNG, JPG, PDF (web), PDF (for print), and PPTX.

Put Your Finished Diagram to Use Anywhere

Export your finished diagram as PNG, JPG, PDF, PPTX, and more, right away. Insert it into a presentation slide, paste it into a report, or share it with a link, all with no conversion step. From creating it to putting it to use, you can finish in one place.

Diagram Templates You Can Use Right Now

Pick a diagram design for your type and purpose and start right away. Every template stays fully editable after you bring it in.

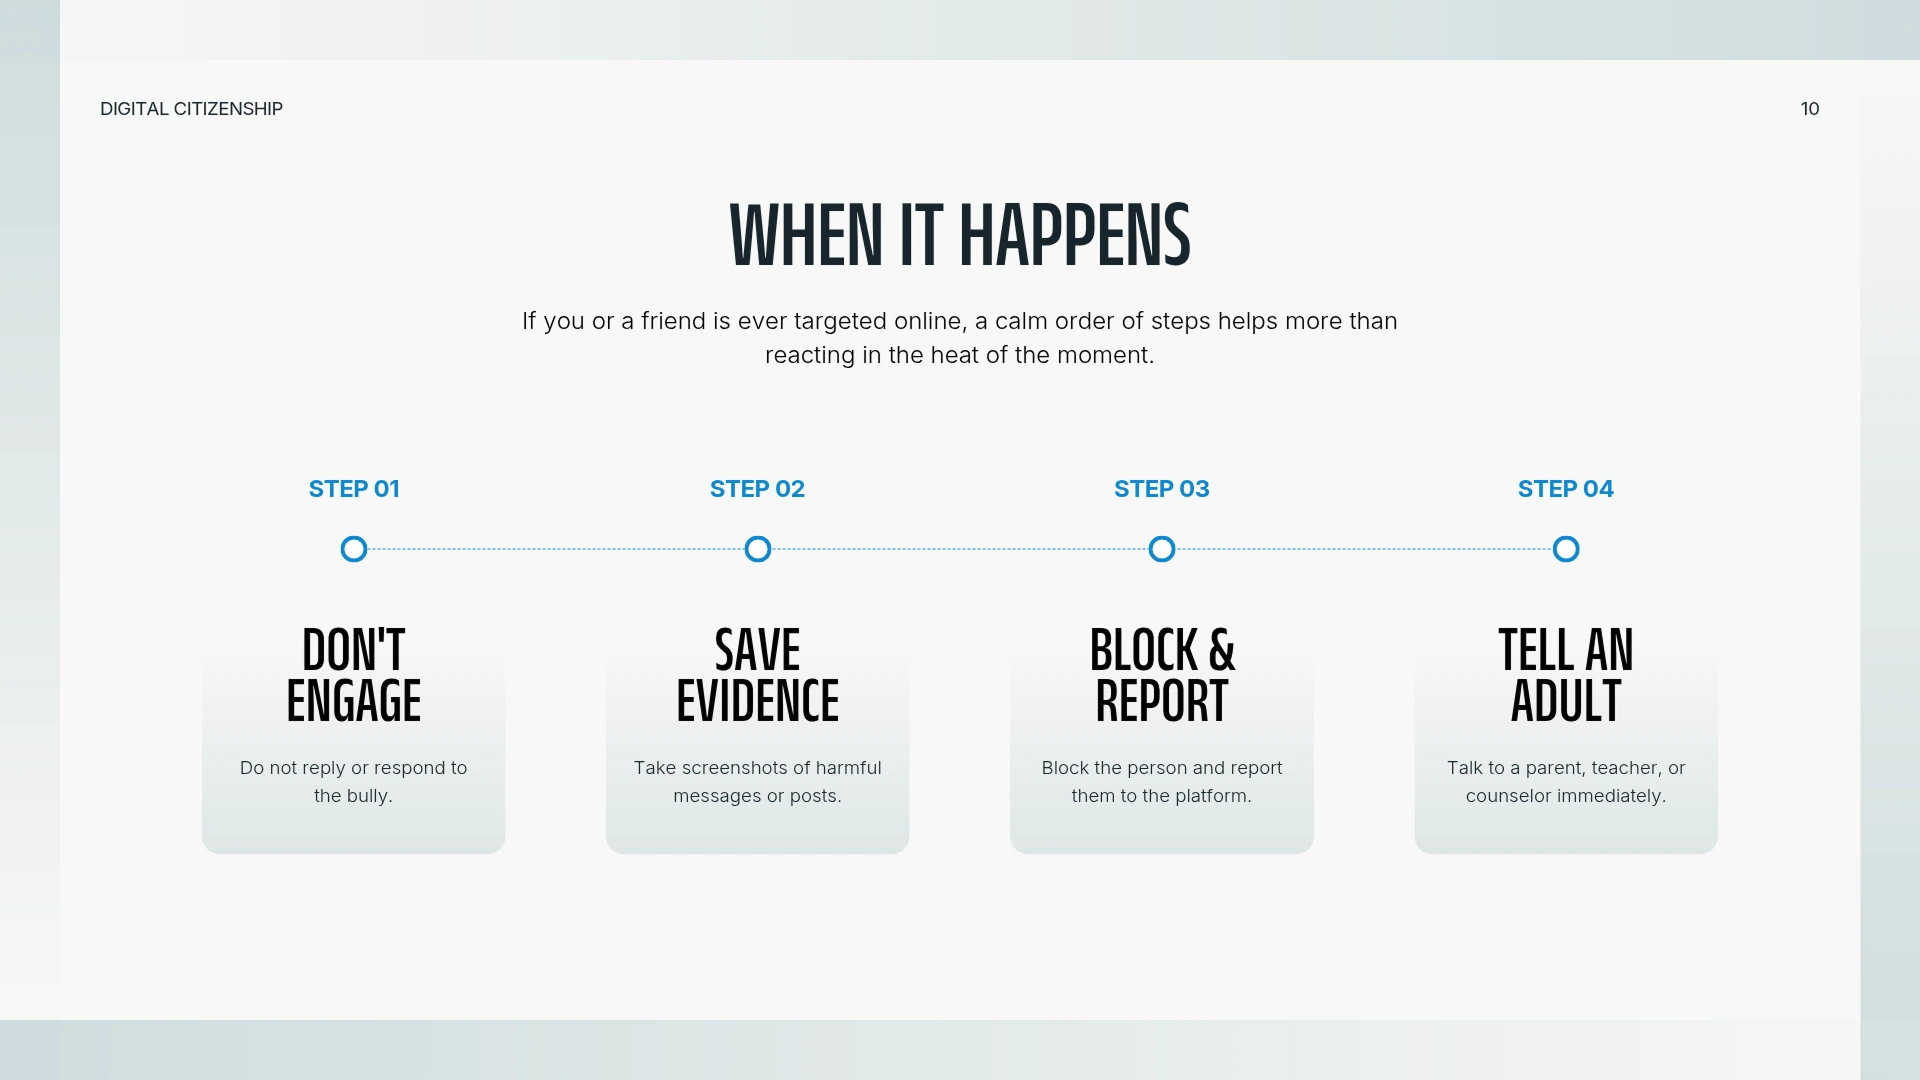
A light-colored slide titled 'When It Happens' displays a four-step timeline diagram showing Don't Engage, Save Evidence, Block & Report, and Tell An Adult connected in sequence.
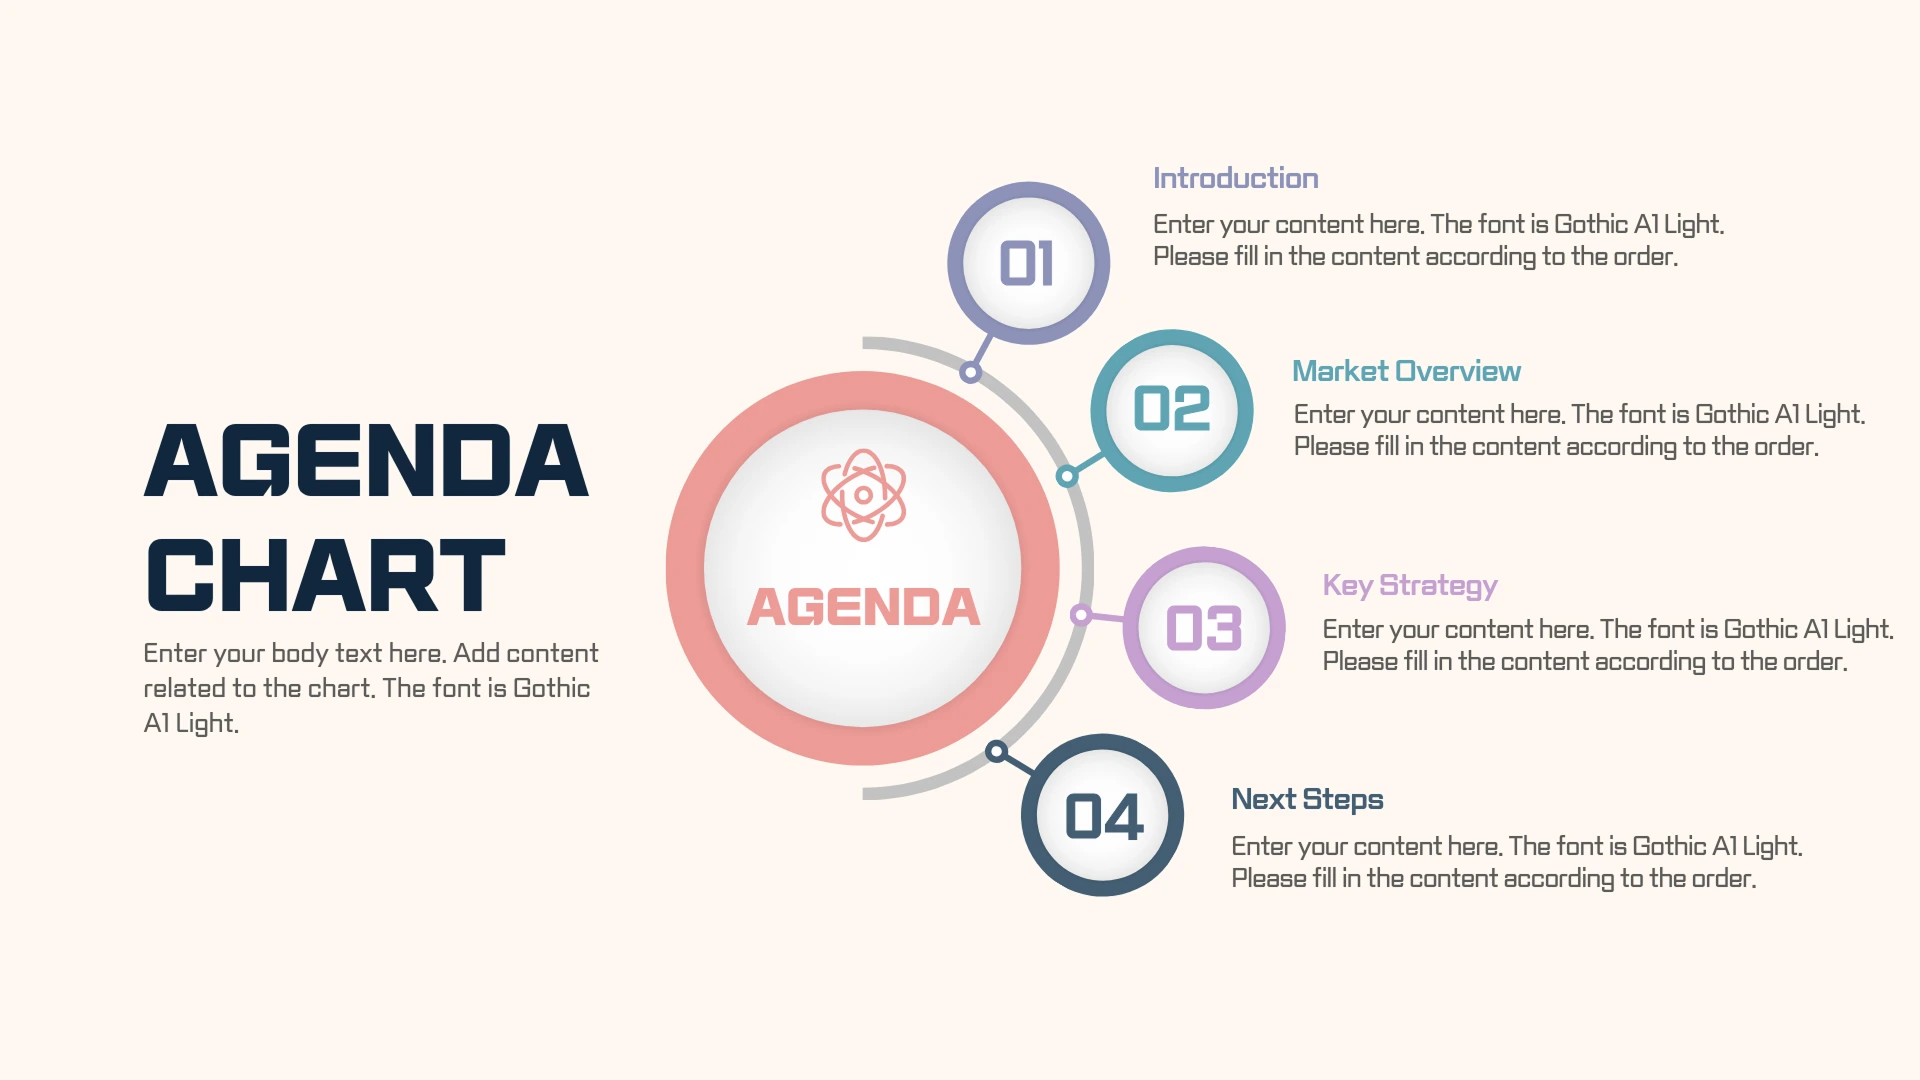
A cream-colored slide titled 'Agenda Chart' shows a circular diagram with a central 'Agenda' hub connected to four numbered items: Introduction, Market Overview, Key Strategy, and Next Steps.
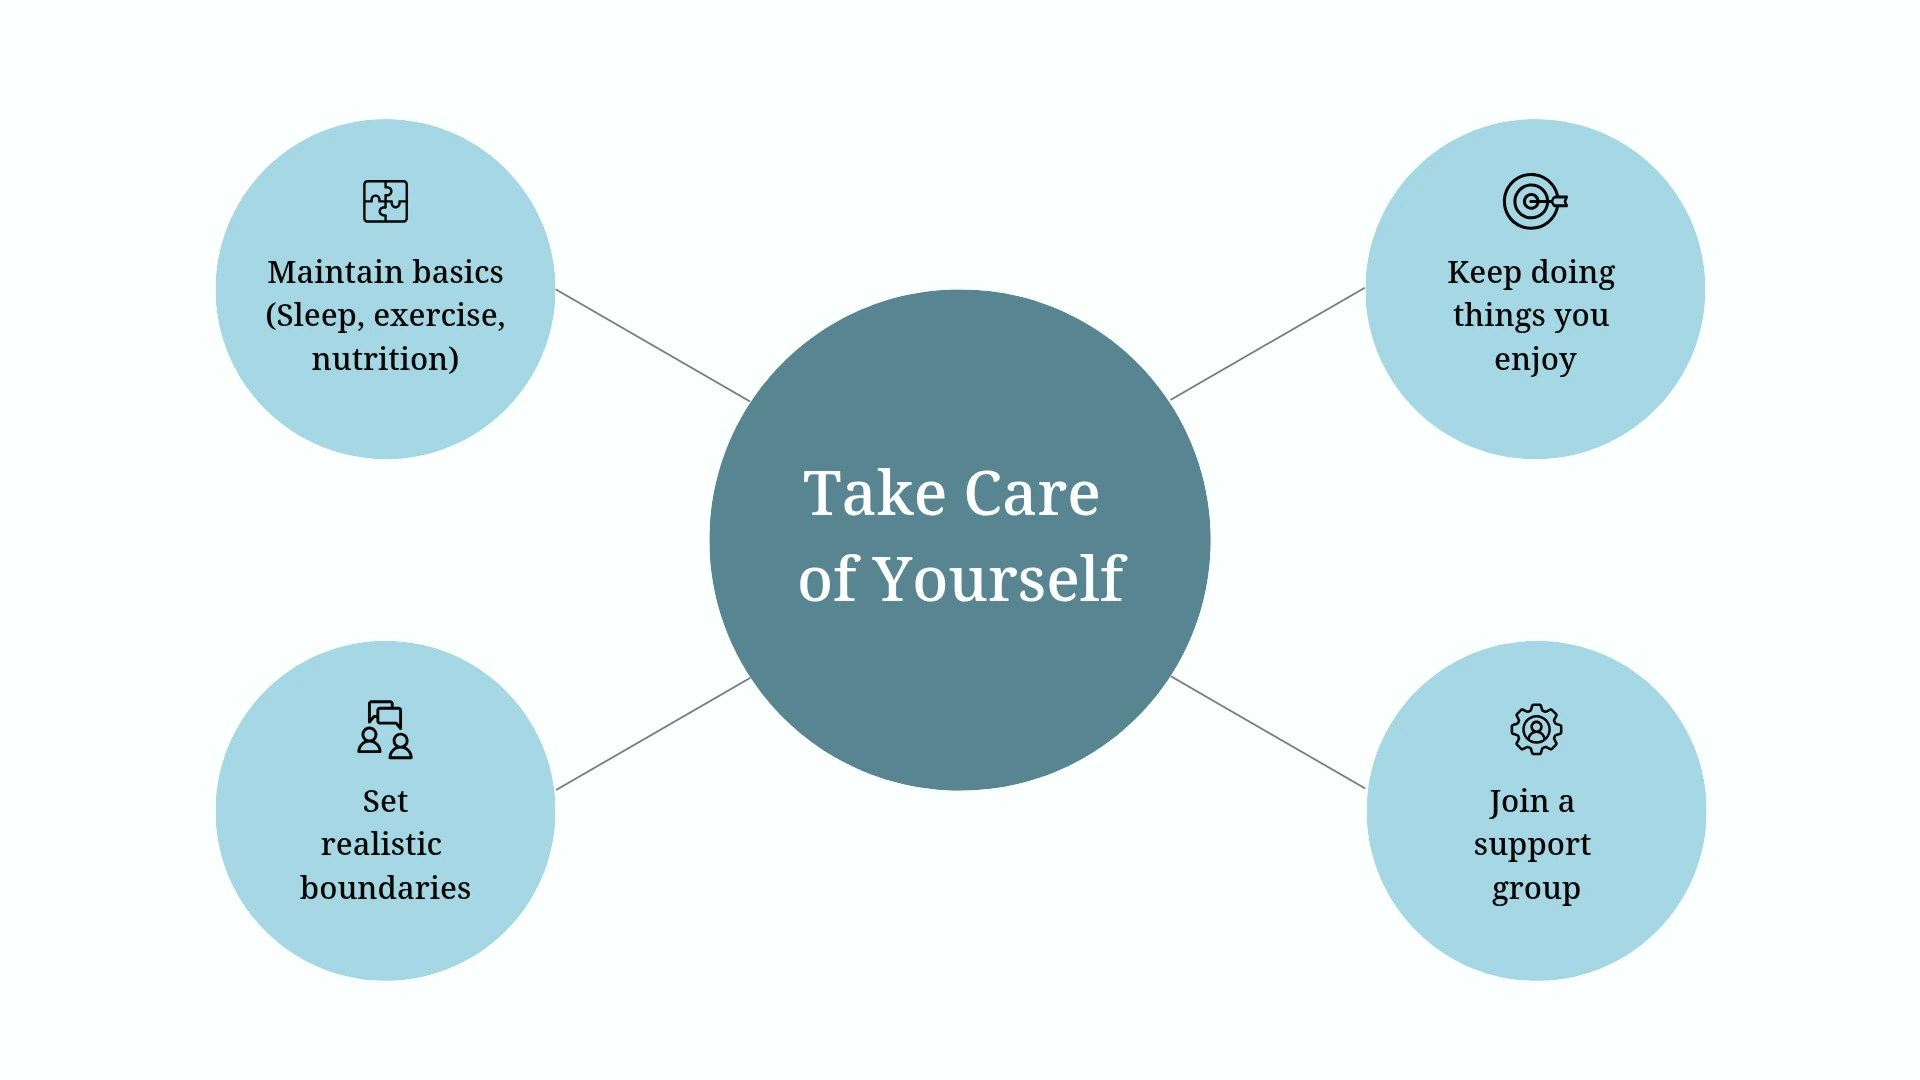
A white slide shows a hub-and-spoke diagram with a central 'Take Care of Yourself' circle connected to four surrounding circles: Maintain basics, Set realistic boundaries, Keep doing things you enjoy, and Join a support group.
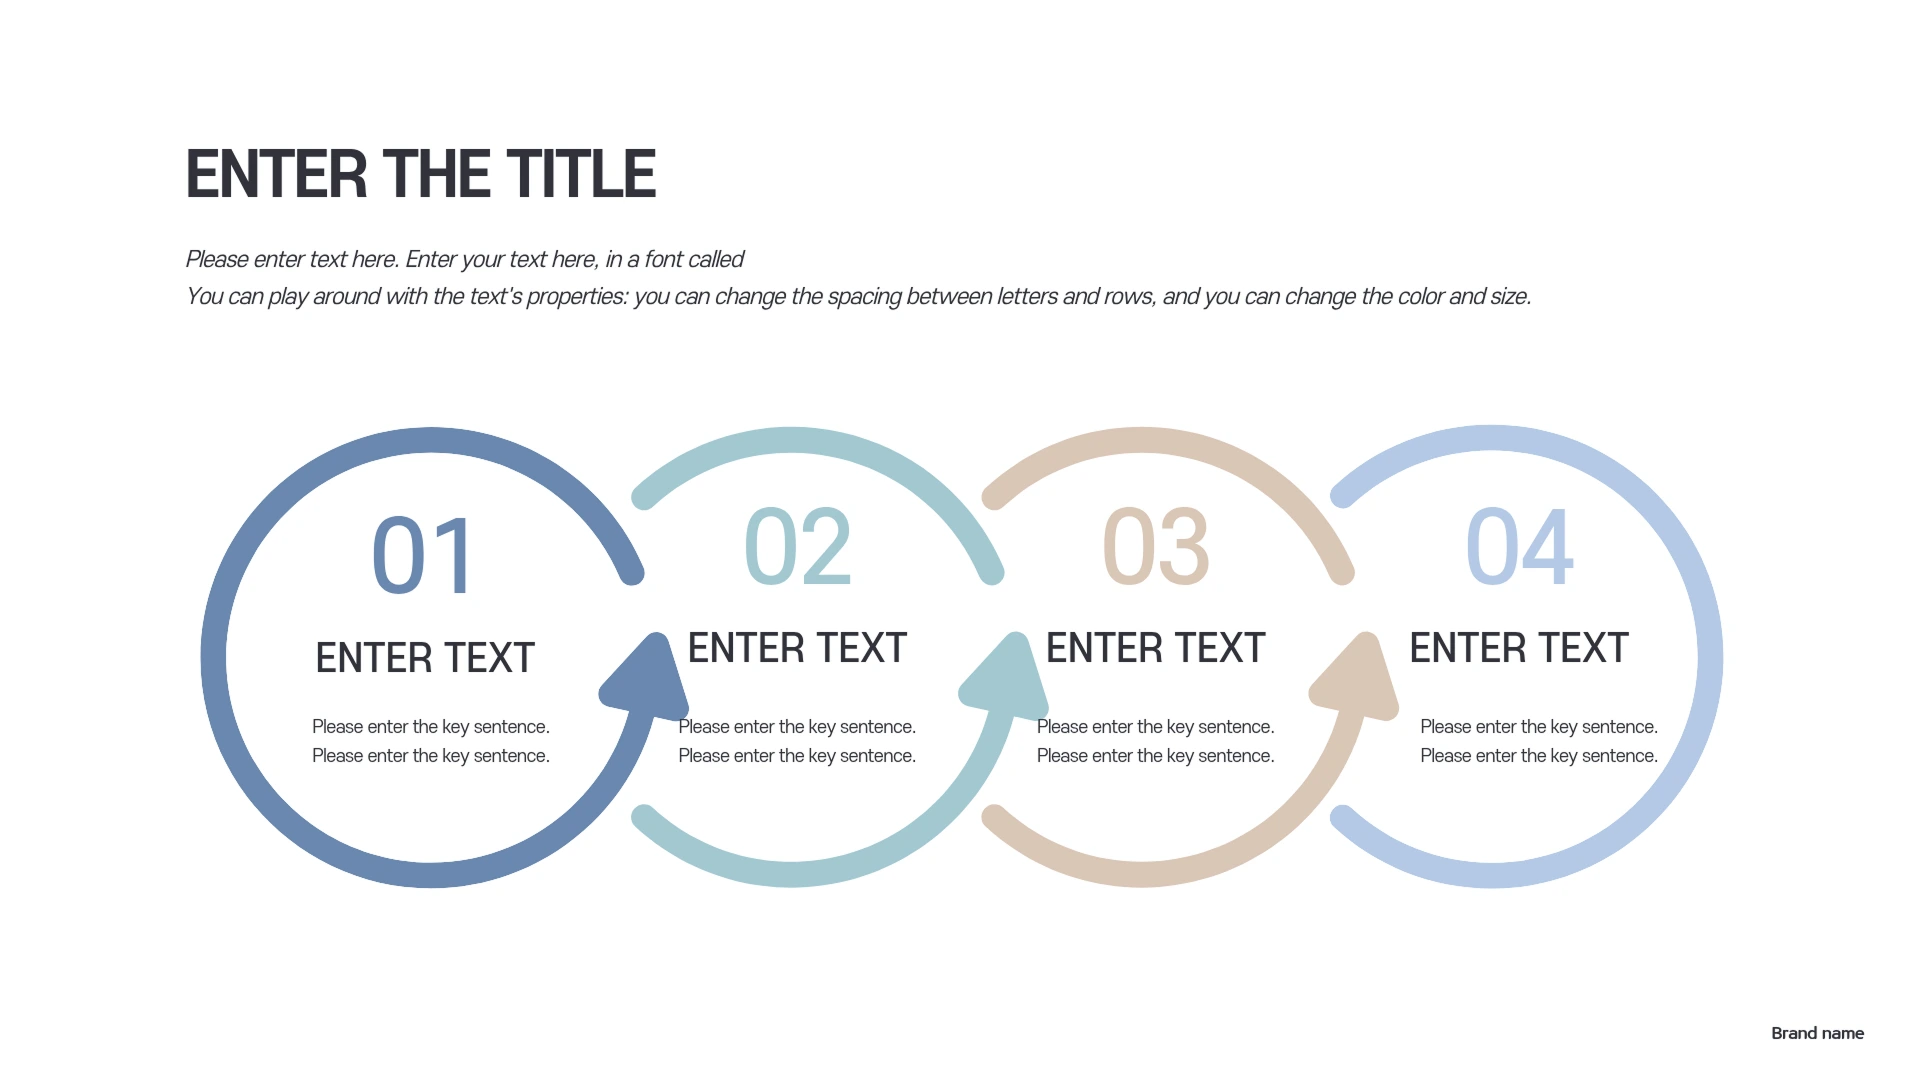
A white slide titled 'Enter the Title' displays a four-step circular process diagram with arrows connecting numbered stages 01 through 04, each paired with a text description.
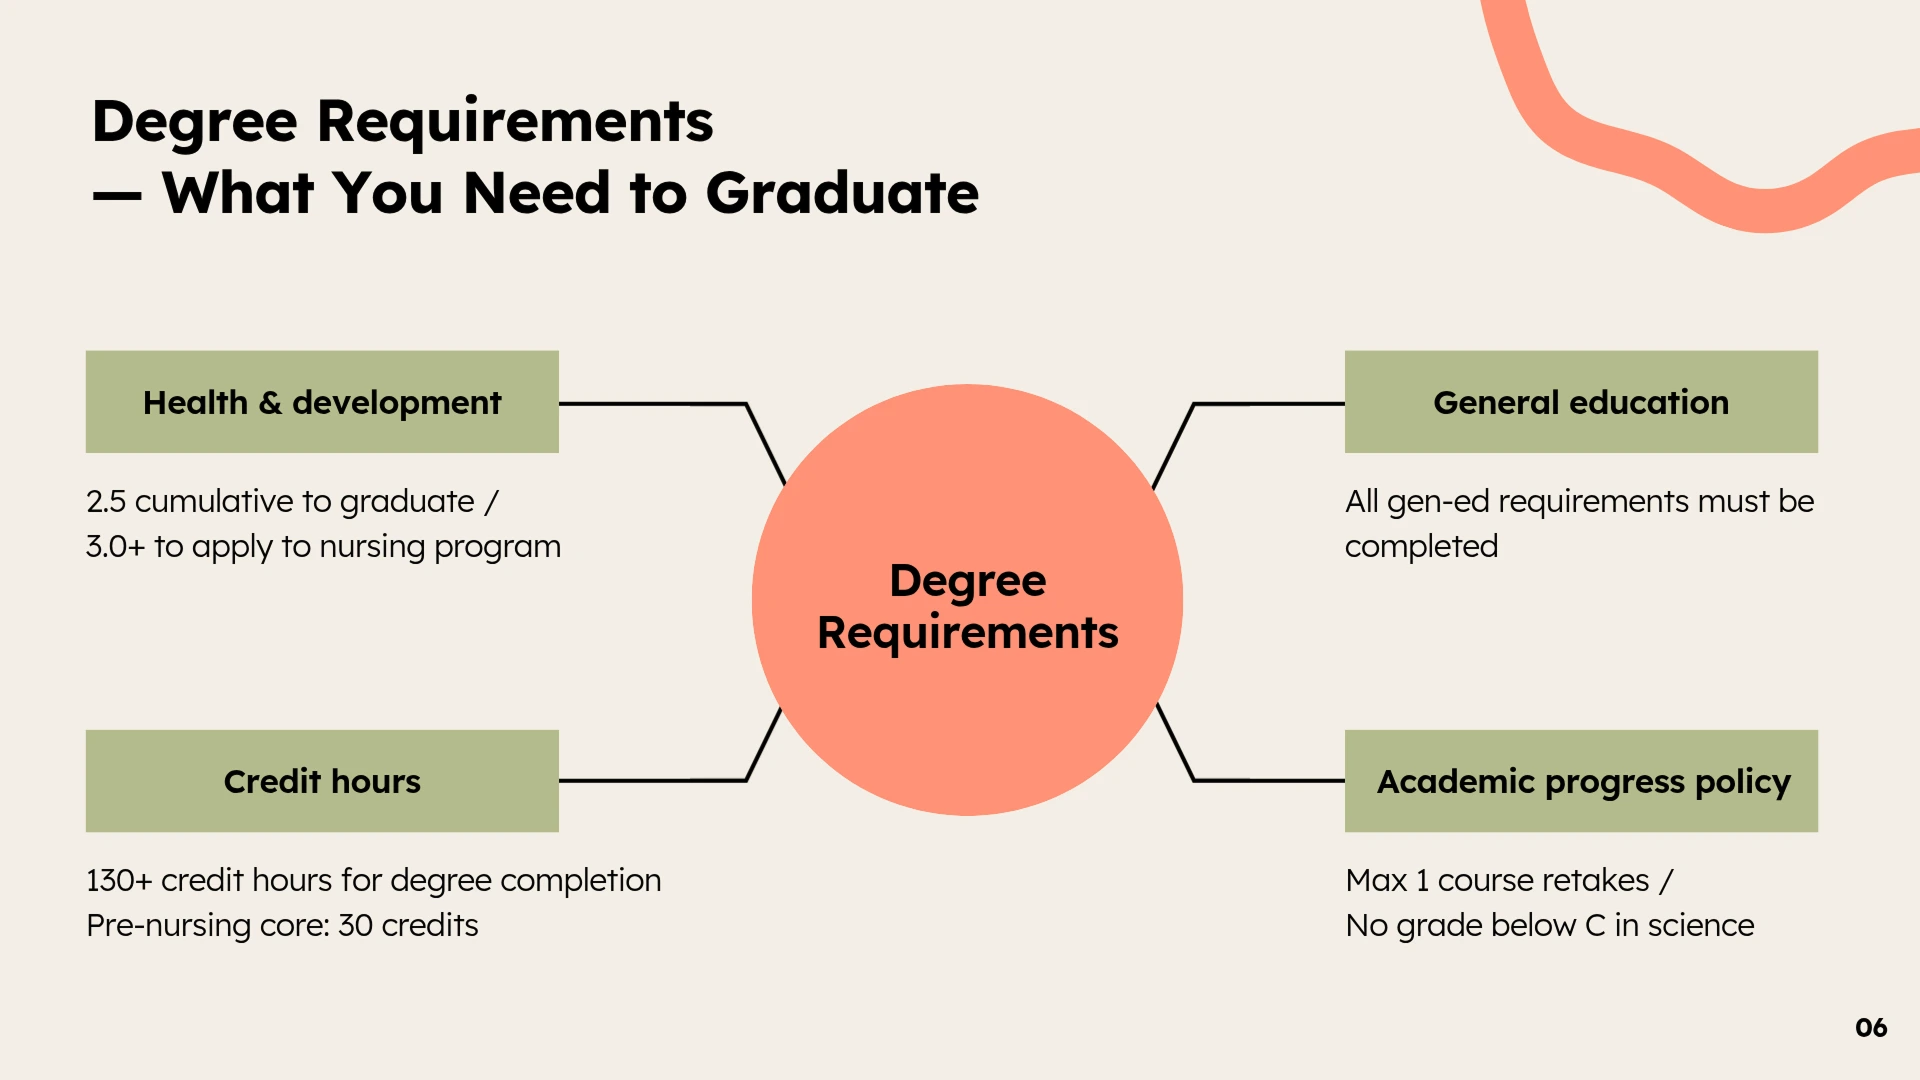
A slide titled 'Degree Requirements — What You Need to Graduate' shows a tree diagram with a central circle branching out to Health & Development, Credit Hours, General Education, and Academic Progress Policy.
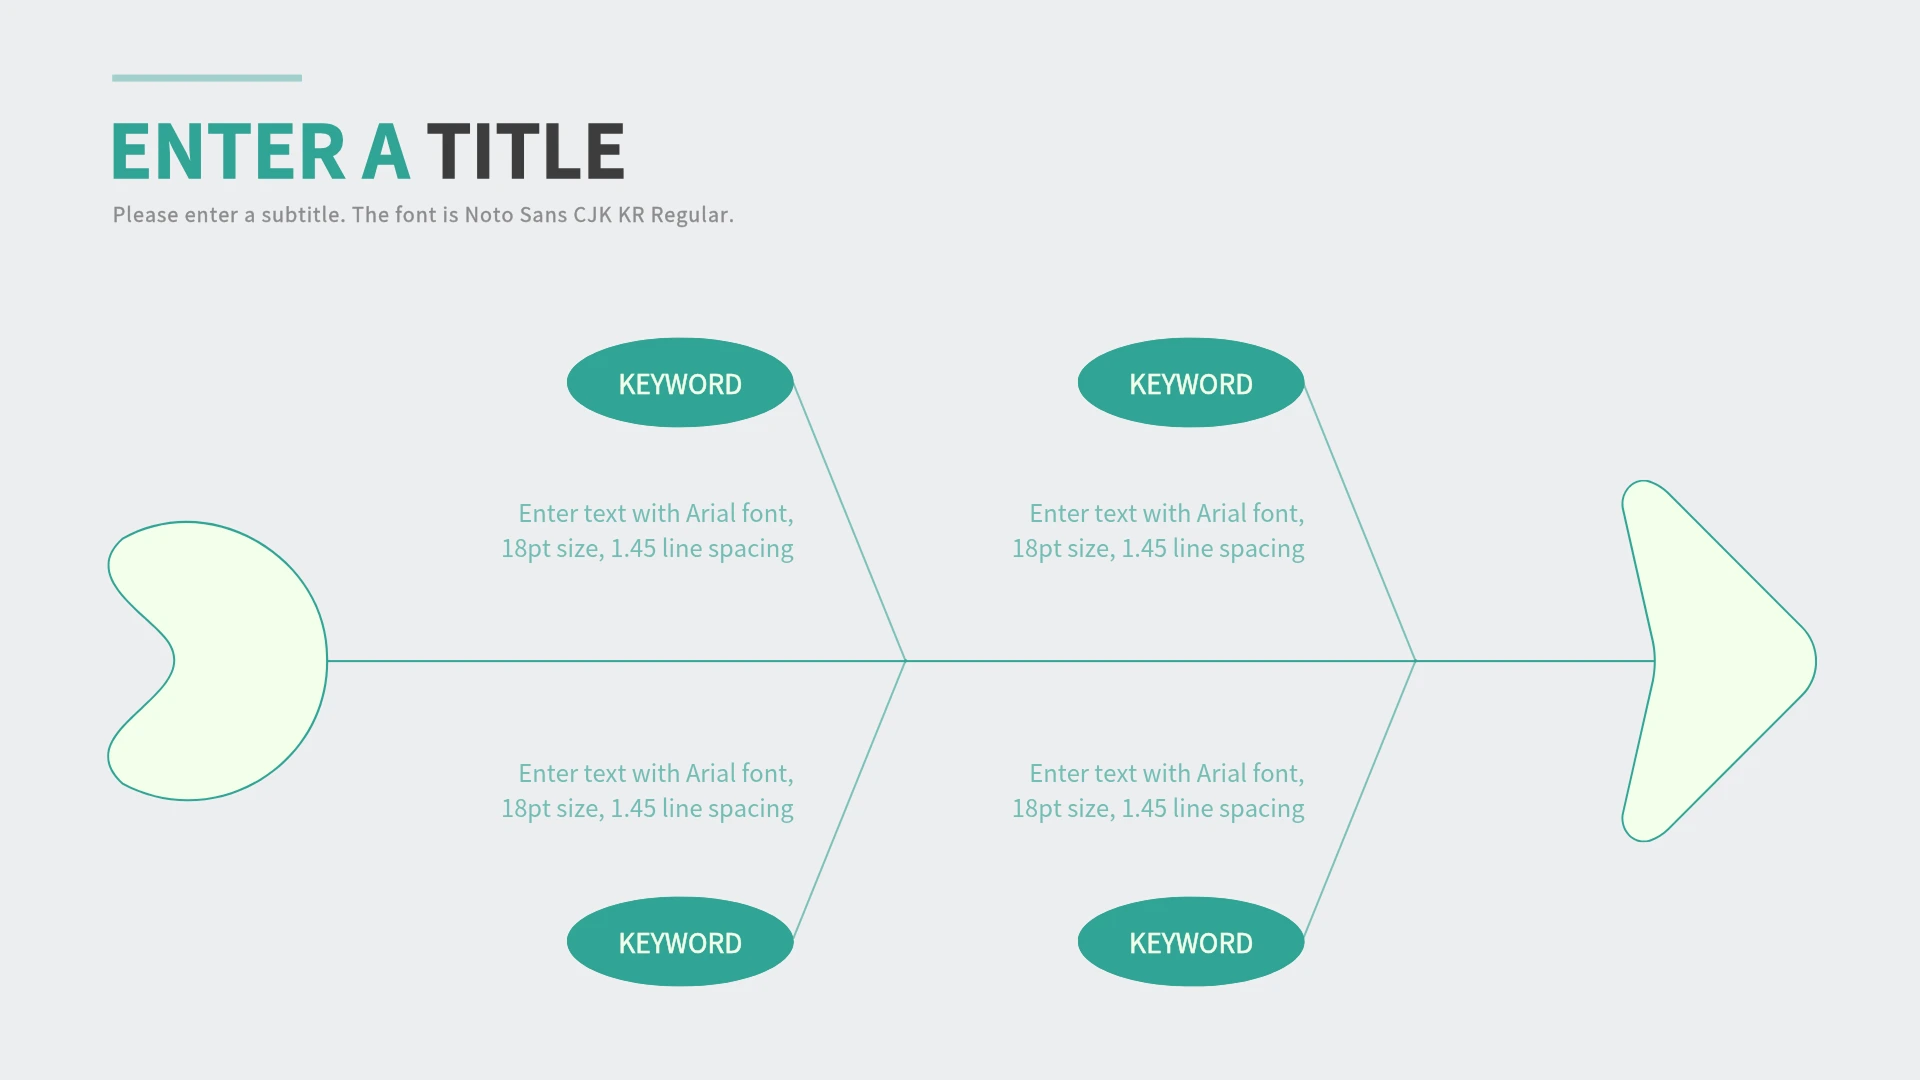
A light gray slide titled 'Enter a Title' displays a fishbone diagram with four keyword ovals branching off a central spine leading to an arrow.
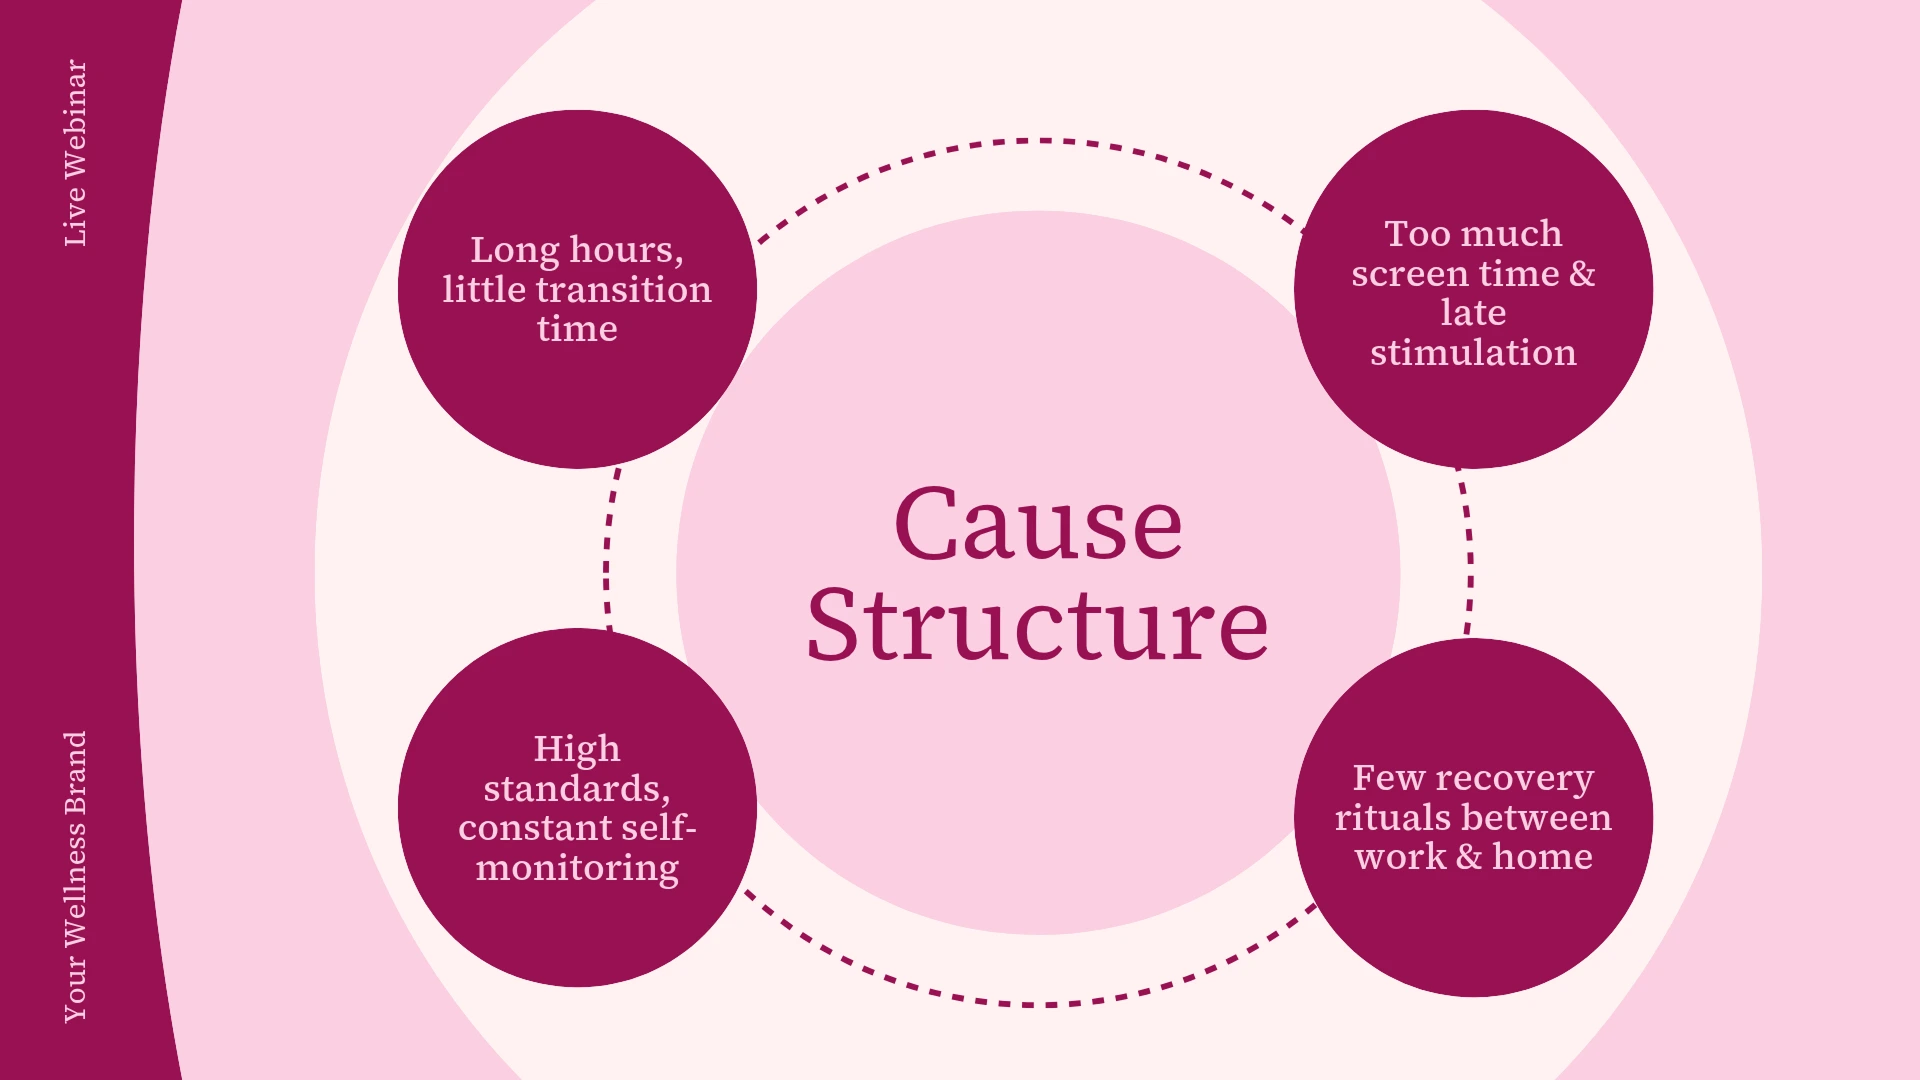
A pink slide titled 'Cause Structure' shows a circular diagram with a central label surrounded by four dotted-line-connected circles: Long hours, Too much screen time, High standards, and Few recovery rituals.
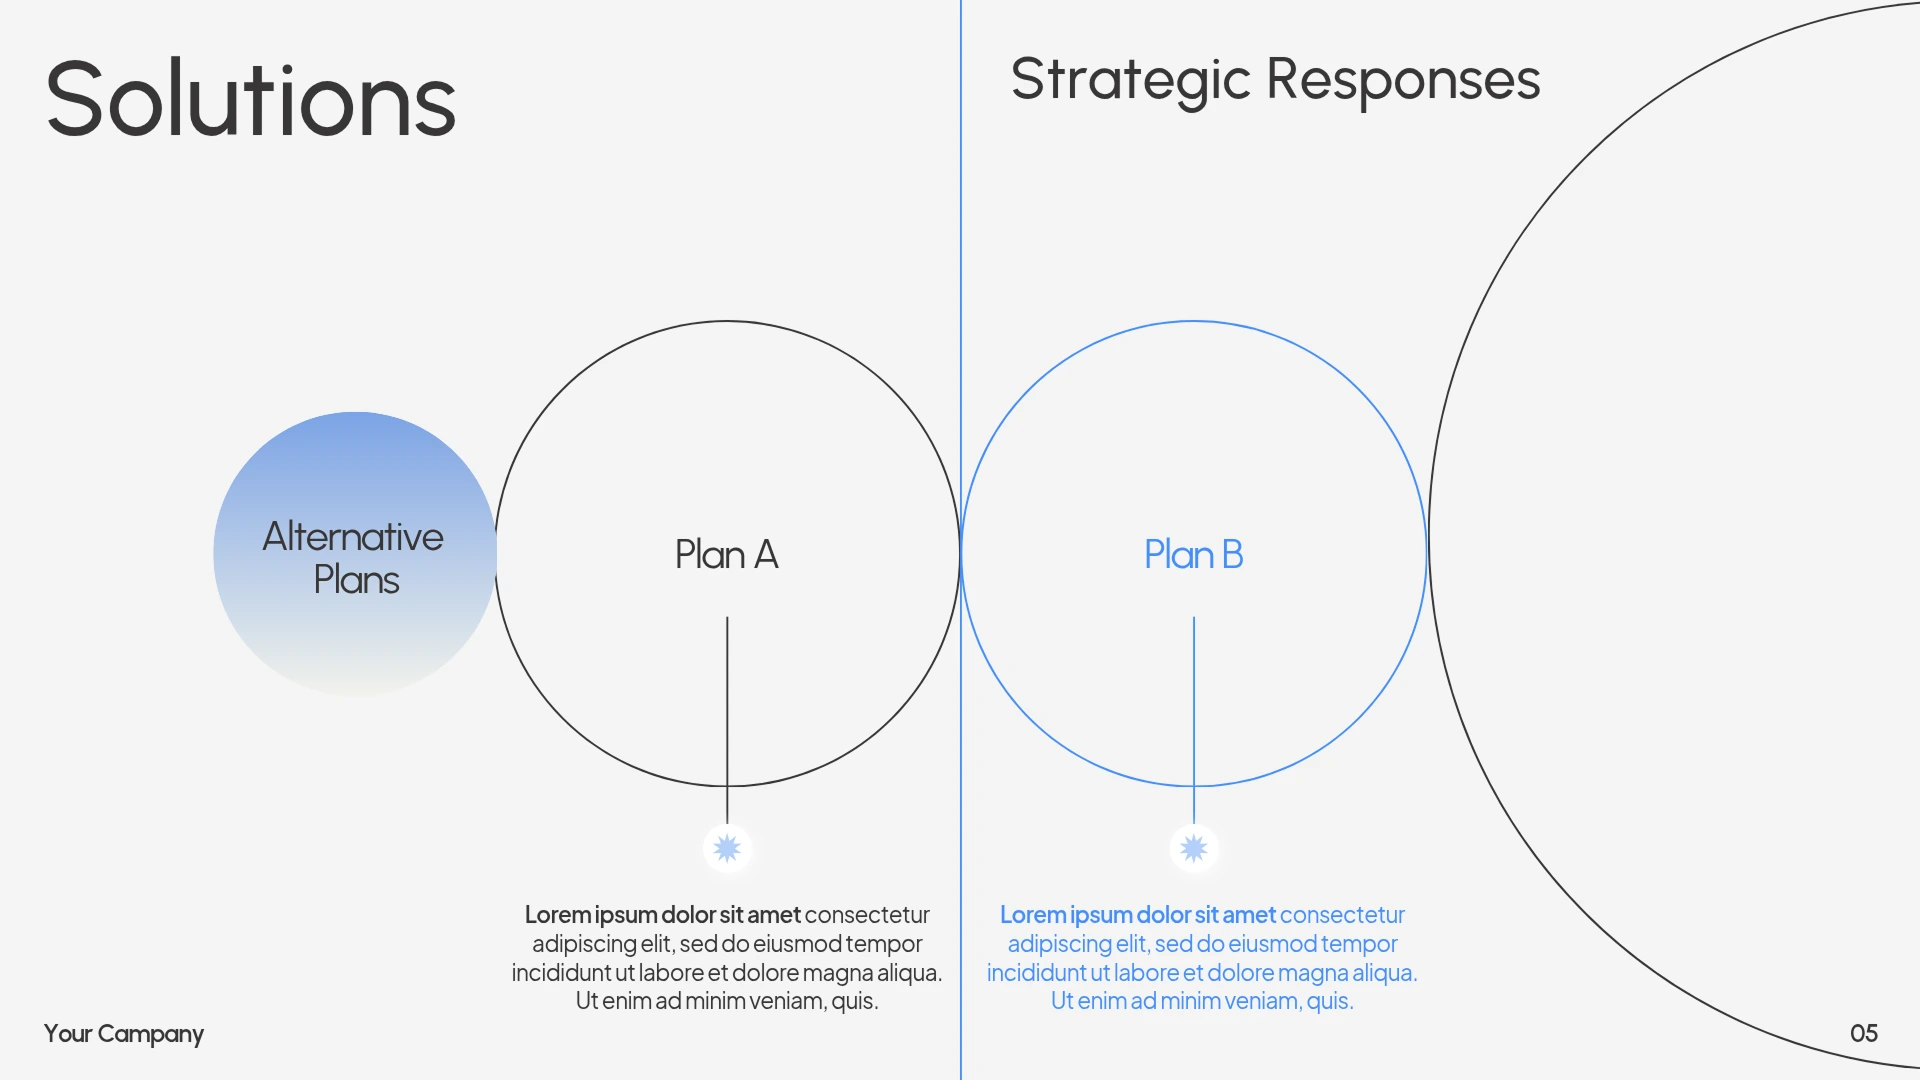
A white slide split into 'Solutions' and 'Strategic Responses' sections displays a Venn diagram with overlapping circles labeled Alternative Plans, Plan A, and Plan B.
View Diagram Templates

FAQ

What types of diagrams are there?

Diagrams come in many forms depending on their purpose.
- Flowchart: Lays out a work procedure or decision flow in order. It's the most common choice for organizing a whole process or showing step-by-step branches.
- Venn Diagram:  Shows how two or more items overlap using circular shapes. It's intuitive for comparing what they share and where they differ.
- Fishbone diagram: Puts a single problem at the center and sorts its causes out like branches. It's used for analyzing the causes of a problem systematically.
- Org chart: Shows the relationships between roles and ranks within an organization as a hierarchy. It's common in team introductions and internal reports.
- ERD (entity-relationship diagram): Shows how data connects within a system. It's mainly used when designing the structure of a service or system.

When should I use a diagram?

A diagram helps when content is complex or when you need to show relationships at a glance. Reach for one in situations like these:
- Organizing a work process or service flow step by step, like the flow from order intake to delivery.
- Comparing two or more items, or visualizing what they share and where they differ.
- Sorting and analyzing the causes of a problem in a structured way.
- Conveying an organization's makeup or role relationships at a glance.
- Showing a complex concept in an easy-to-understand way in a talk or report.

What's the difference between a diagram and a graph?

Both visualize information, but the kind of content they show is different.
- A graph shows numerical data and the relationships between variables. Bar graphs, line graphs, area charts, and the like are good for showing the size or change of values based on numbers.
- A diagram focuses on structure and relationships rather than figures. It shows how items connect, how a flow continues, and what structure the whole is built on. The hallmark of a diagram, like a flowchart or Venn diagram, is that it can convey concepts and context without any numbers at all.

Is the MiriCanvas diagram maker free?

Yes, you can make diagrams on the free plan. You also get free access to over 50,000 templates and over 350,000 photos and graphics. If you want premium templates and AI features too, upgrade to the Pro plan. You can see the details on the pricing page.

Can I insert my finished diagram into PowerPoint?

Yes. Once your diagram is complete, export it as a PPTX file and open it directly in PowerPoint. If you'd prefer to build the entire presentation in MiriCanvas, you can also try the AI Presentation Maker.

Create your diagram now.

Simply choose a template you like and fill in the content. Colors and shapes can be adjusted with just a few clicks.
Start for free with Miricanvas.

Create a Diagram