
Tools

AI資料作成
AIプレゼンテーション
BEST
AI文章作成·作文
AI ポスター
AIかんたん作成
AI画像生成
AI動画生成
HOT
AI キャラメーカー
AI アイコン作成ツール
AI アイコンメーカー
AIイラスト生成
AI ロゴメーカー
AI フリー背景素材
AIクイック編集
AI画像編集
背景除去
高画質化
写真イラスト化
HOT
New!

イラスト一覧を見る
幅広いシーンで使える高品質イラストをご用意しています。
Plans


Start making tables in MiriCanvas. Pick a table design you like, drop in your data,
and you'll have a polished table that's ready to use in any report or presentation.ports or presentations (PPT).
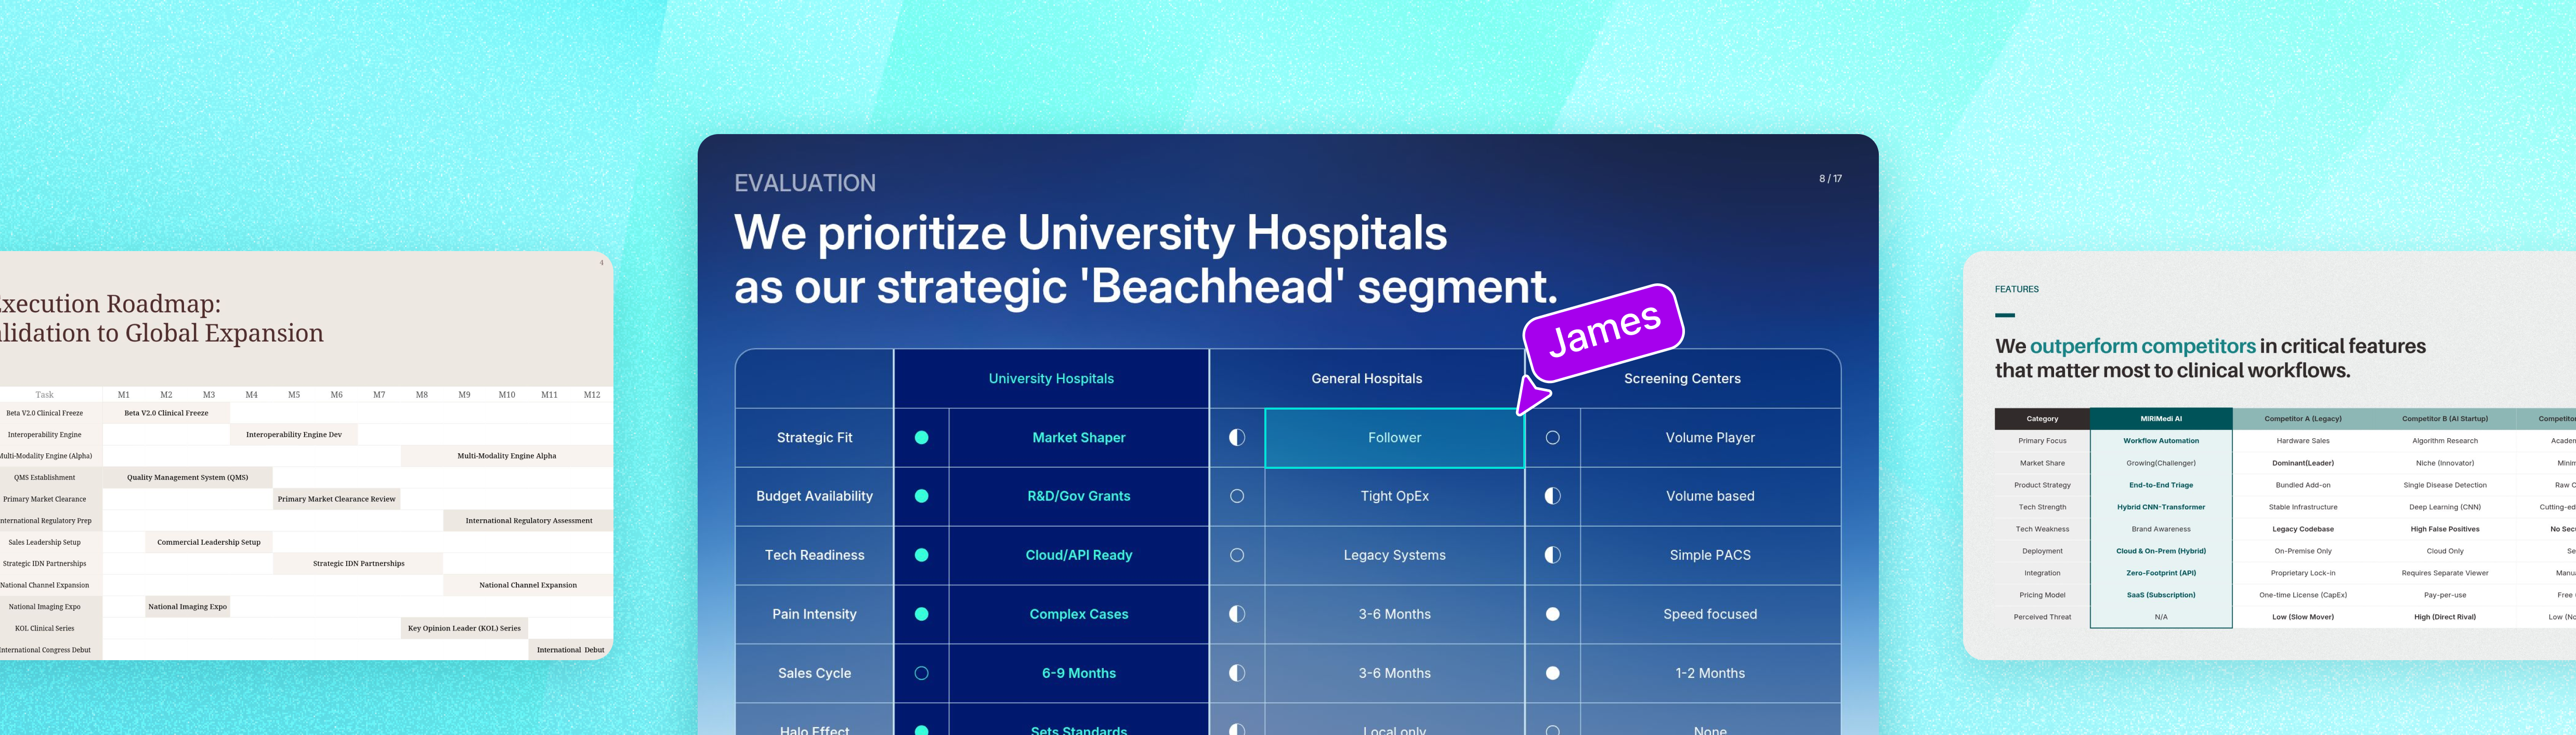
From entering your data to refining the design, MiriCanvas handles every step of making a table in one place.

Even complex tables come together automatically once you enter your data.

Pick from a wide range of professionally designed templates and create a polished result in seconds.

Adjust fonts, colors, borders, and every other element to match your own style.

Add your finished table to a presentation or report, or export it as an image or PDF.
A table organizes data into rows and columns. While charts and graphs are great for showing overall trends or proportions at a glance, a table is built for lining up individual figures and items so you can compare them precisely.
Familiar formats like price lists, report cards, and schedules are all tables. They work best when you need to compare specs or conditions across several items side by side, or when you're dealing with data that's too dense to explain in plain sentences.
Start from a template: Open the Templates menu on the MiriCanvas site, or click Create a design and search "table" in the Templates menu on the left of the editor.
Start from an element: Select a table from the Elements menu on the left and add it straight to your canvas.
If you started from a template, pick a design that fits your purpose, such as a report or a presentation. Filter by formats such as Presentation or Vertical Document helps you find the right table template faster. If you started from an element, you can skip this step.
Once the table is on your canvas, drag to add or remove rows and columns freely.
Click a cell and type your text or numbers right in. You can also copy data from Excel or Google Sheets and paste it straight in.
Use the table settings panel on the left to adjust background color, borders, and line weight to your taste. Select an individual cell to change its color, font, or alignment on its own.
Export your finished table as PNG, PDF, PPTX, and more. Drop it straight into a presentation, or share it with a link.
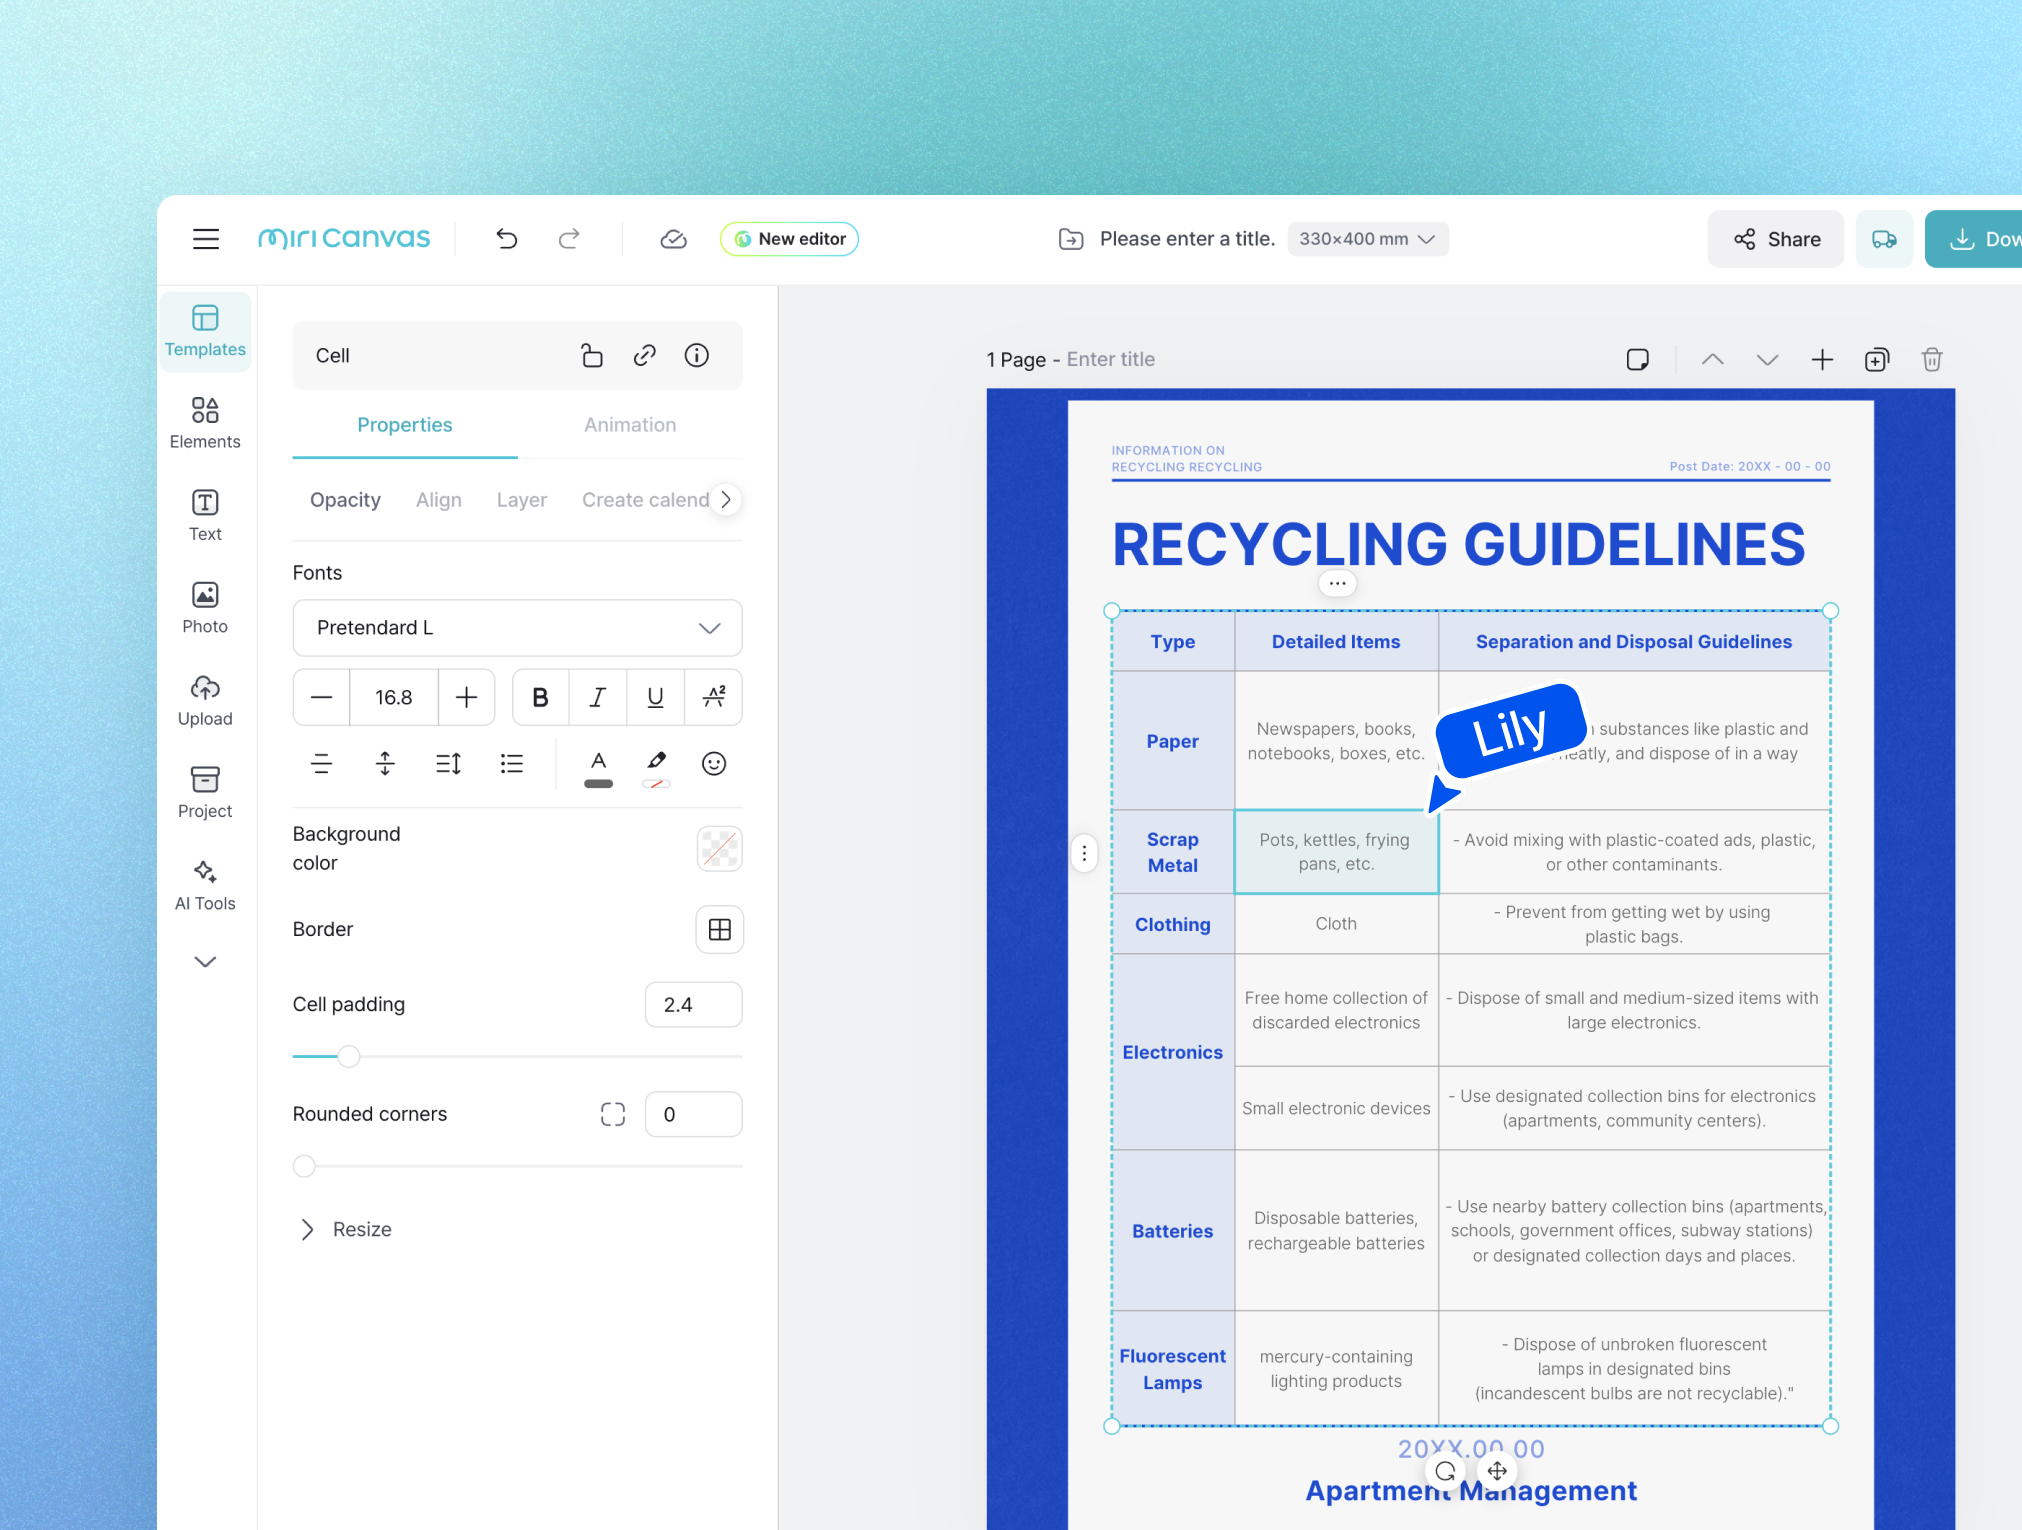

Organize your information into a clean table. Copy data from Excel or Google Sheets and paste it straight into your table, with no retyping from scratch. Adding rows and columns, reordering them, and merging cells all happen with a simple drag, so restructuring takes no time at all.
Want a great-looking table fast? Choose a table template built for your purpose and just fill in your content.
The design is already done, so you won't spend time building it from scratch. From work reports and student presentations to data summaries for marketers, there's a table template for every situation.
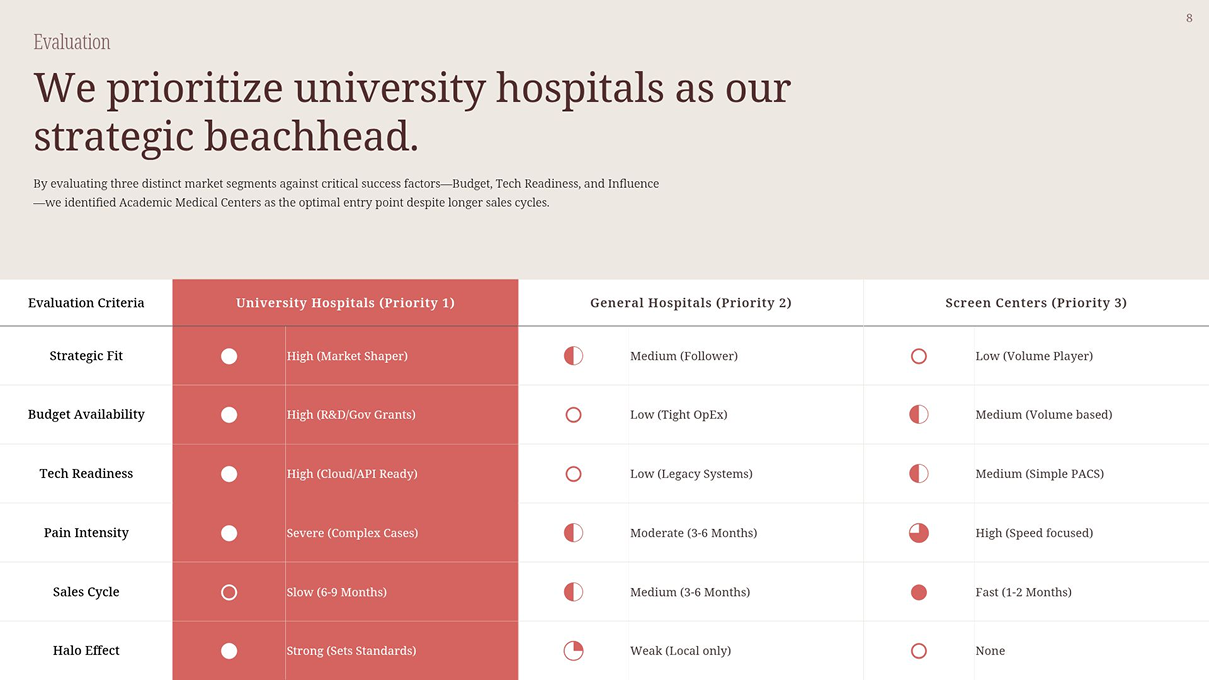
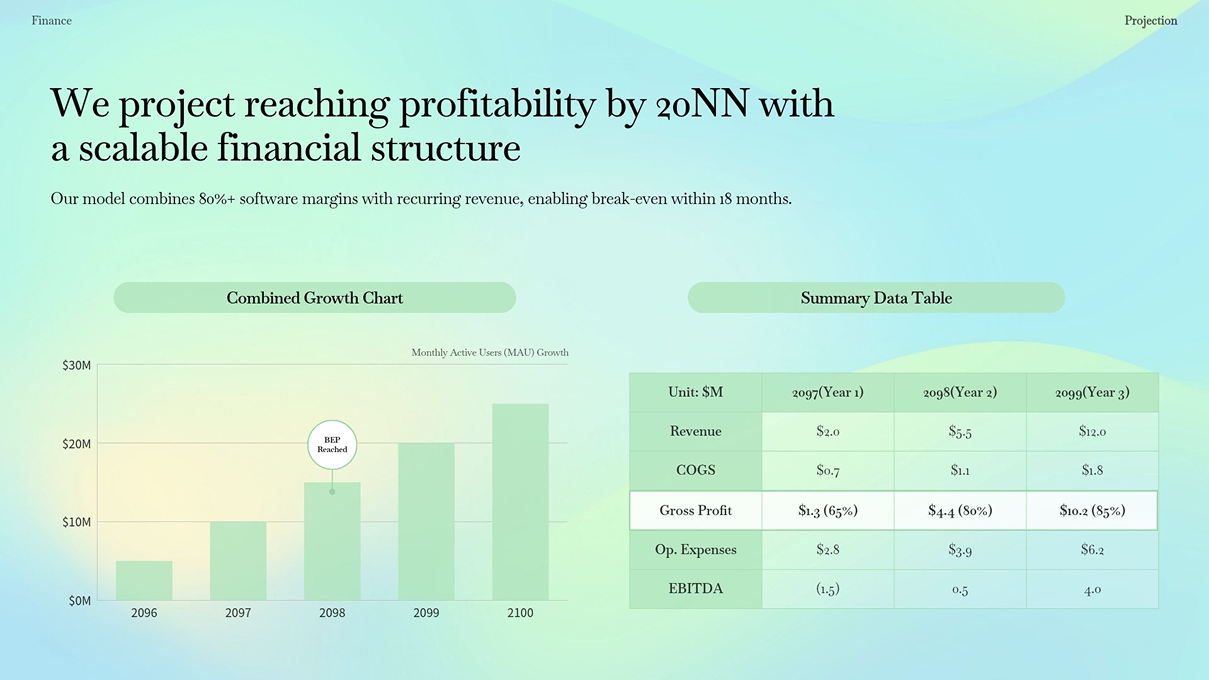
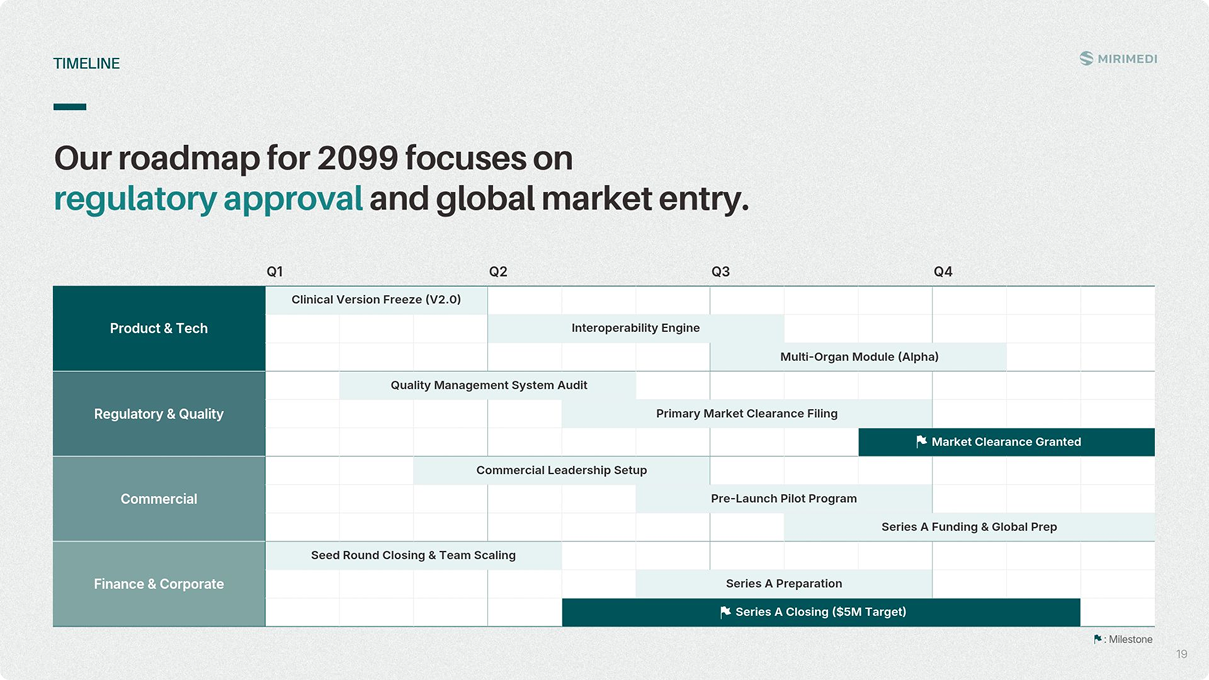
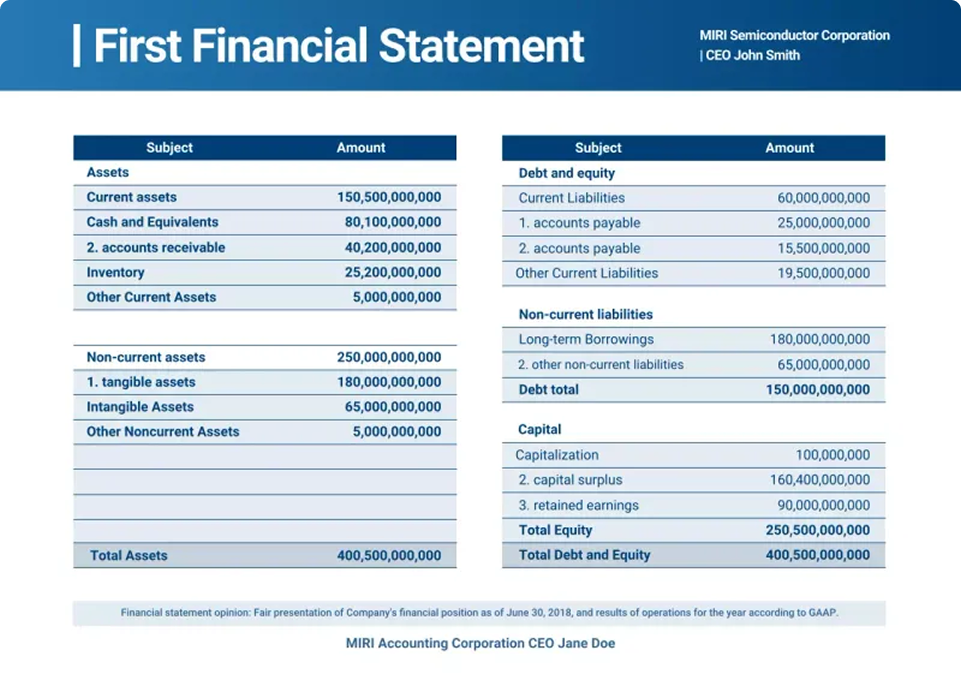
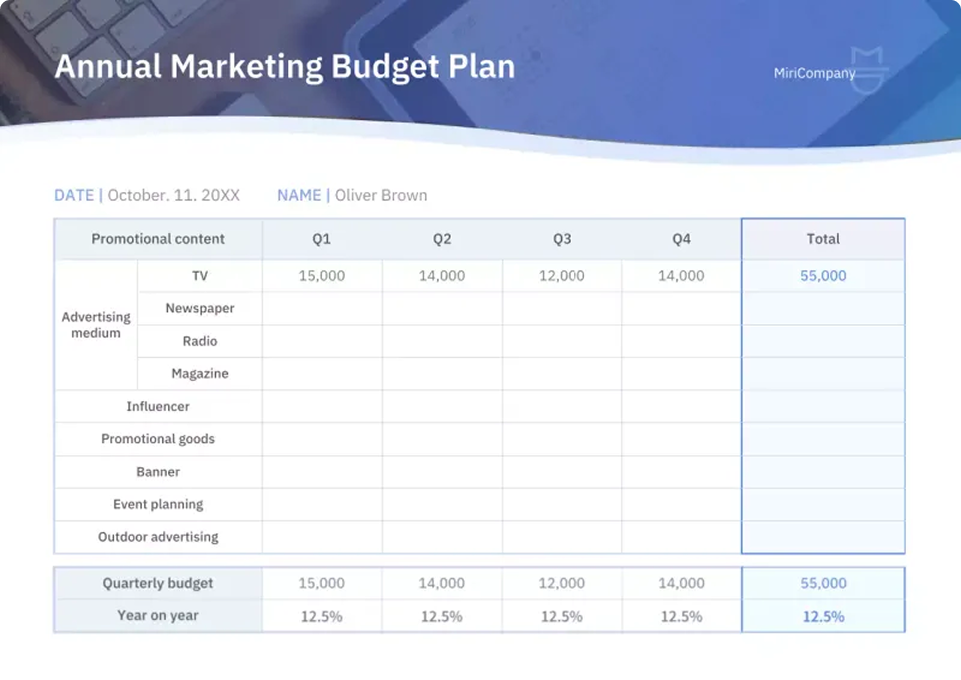

You don't have to use a template as-is. Customize cell background colors, border weight and style, fonts, and text size for each element separately. Round the corners for a softer look that suits price lists, schedules, and other everyday tables. Drag rows and columns to move them, and your text and styling stay exactly as they were.
From reports and presentations to comparison tables and schedules, pick a table design for your purpose
and start right away. Beyond standard tables, you'll find templates in a range of themes such as calendar tables and clothing size charts, and every template is fully editable.

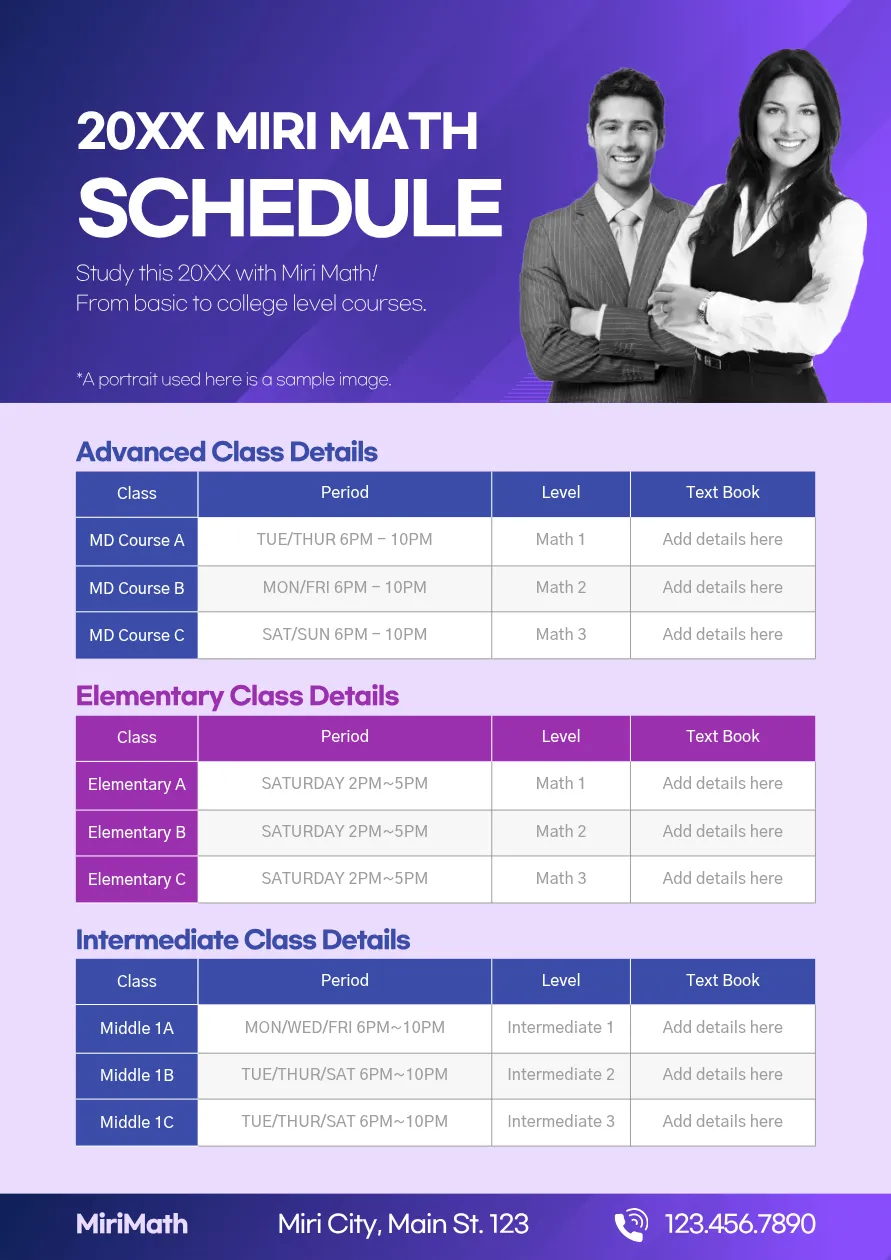

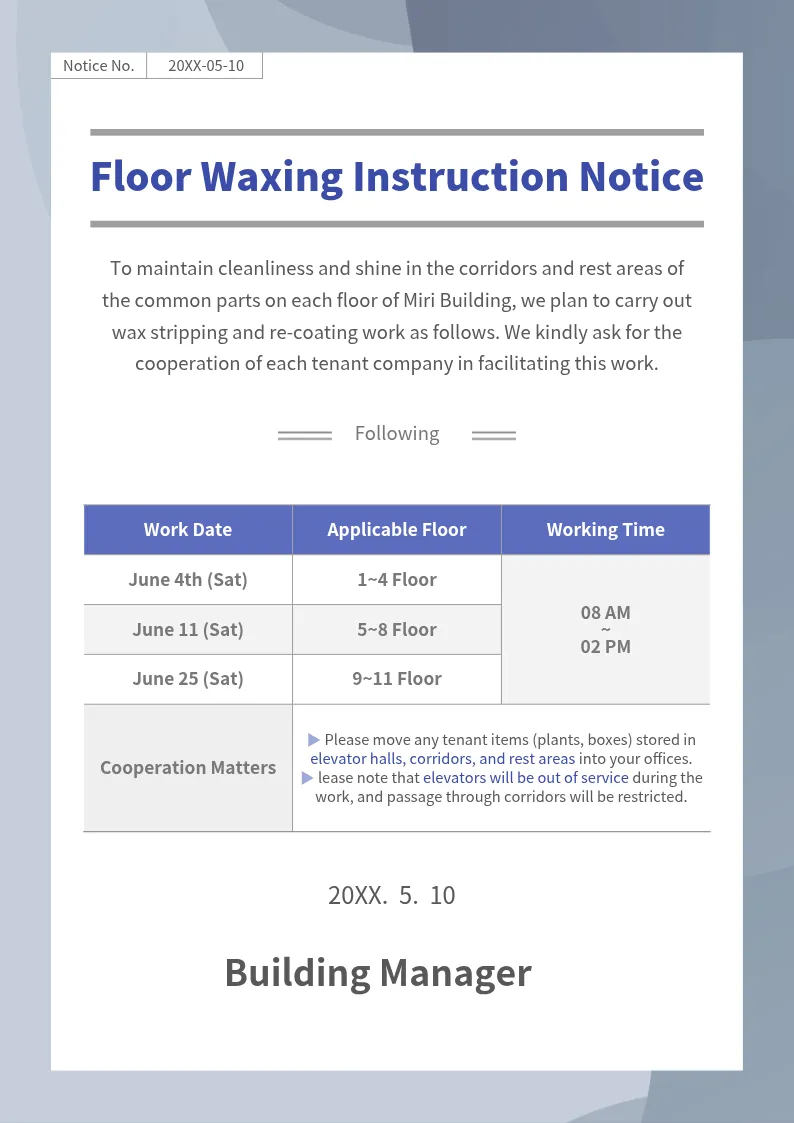
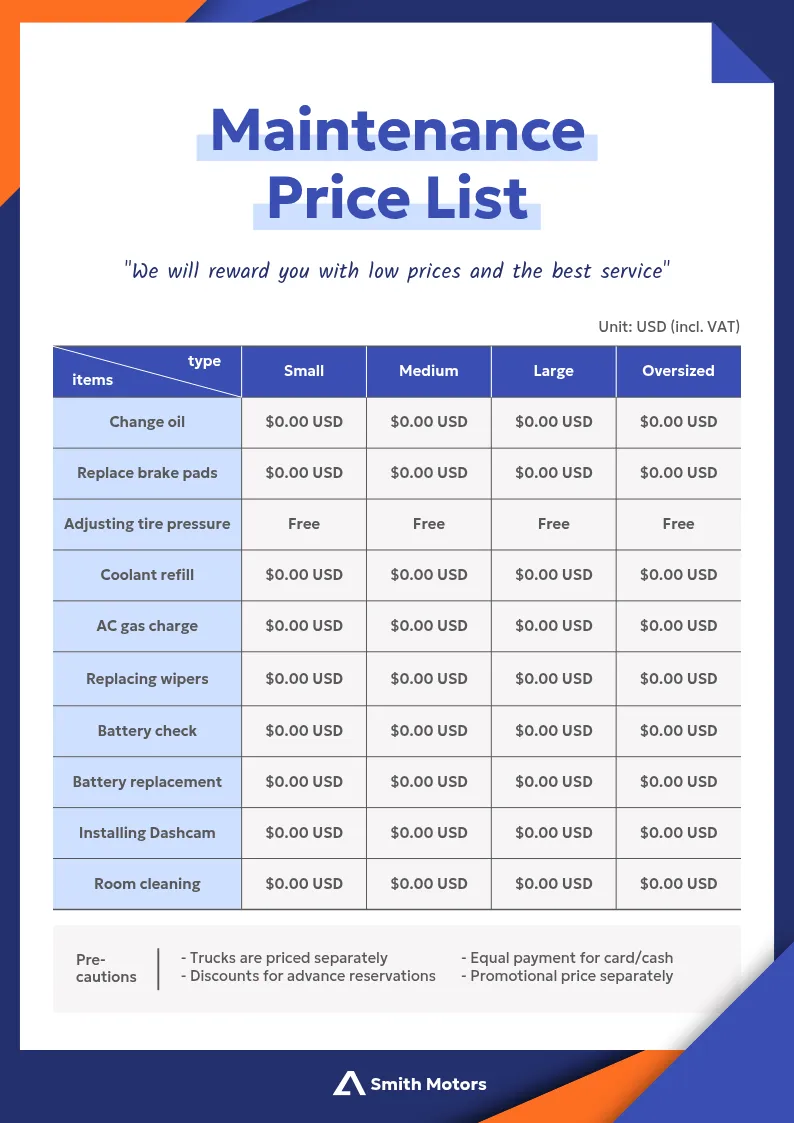
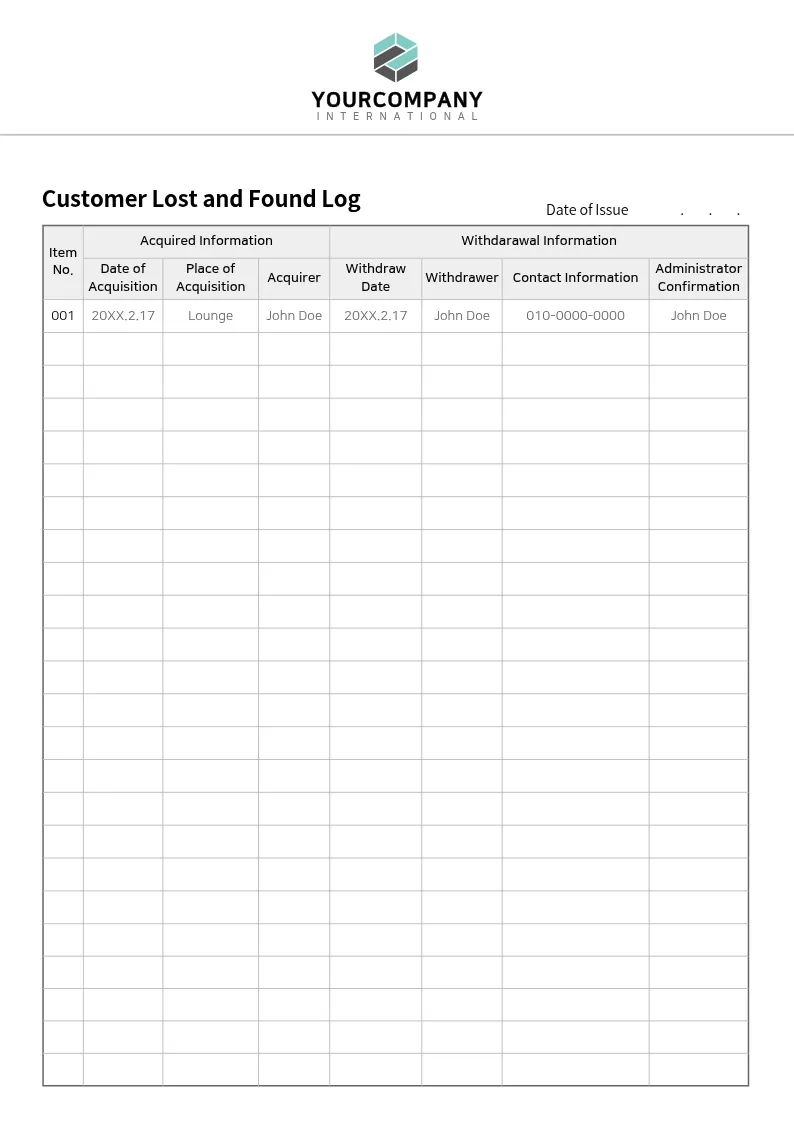

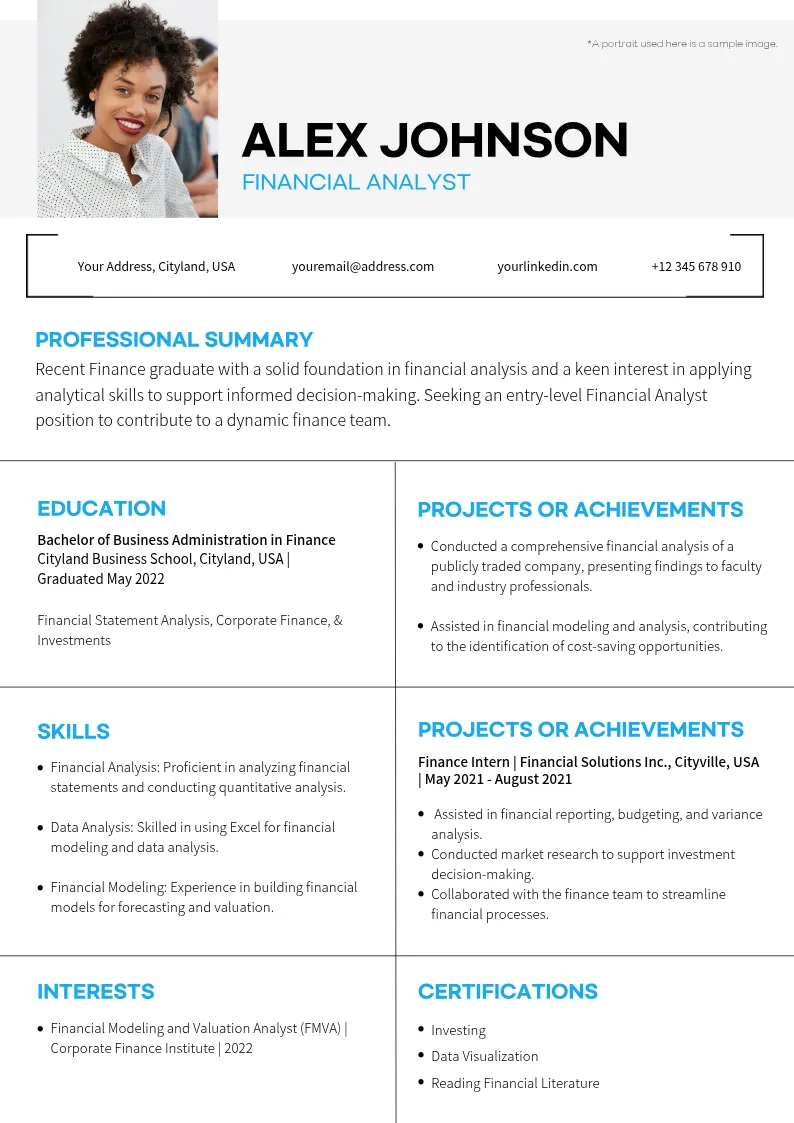
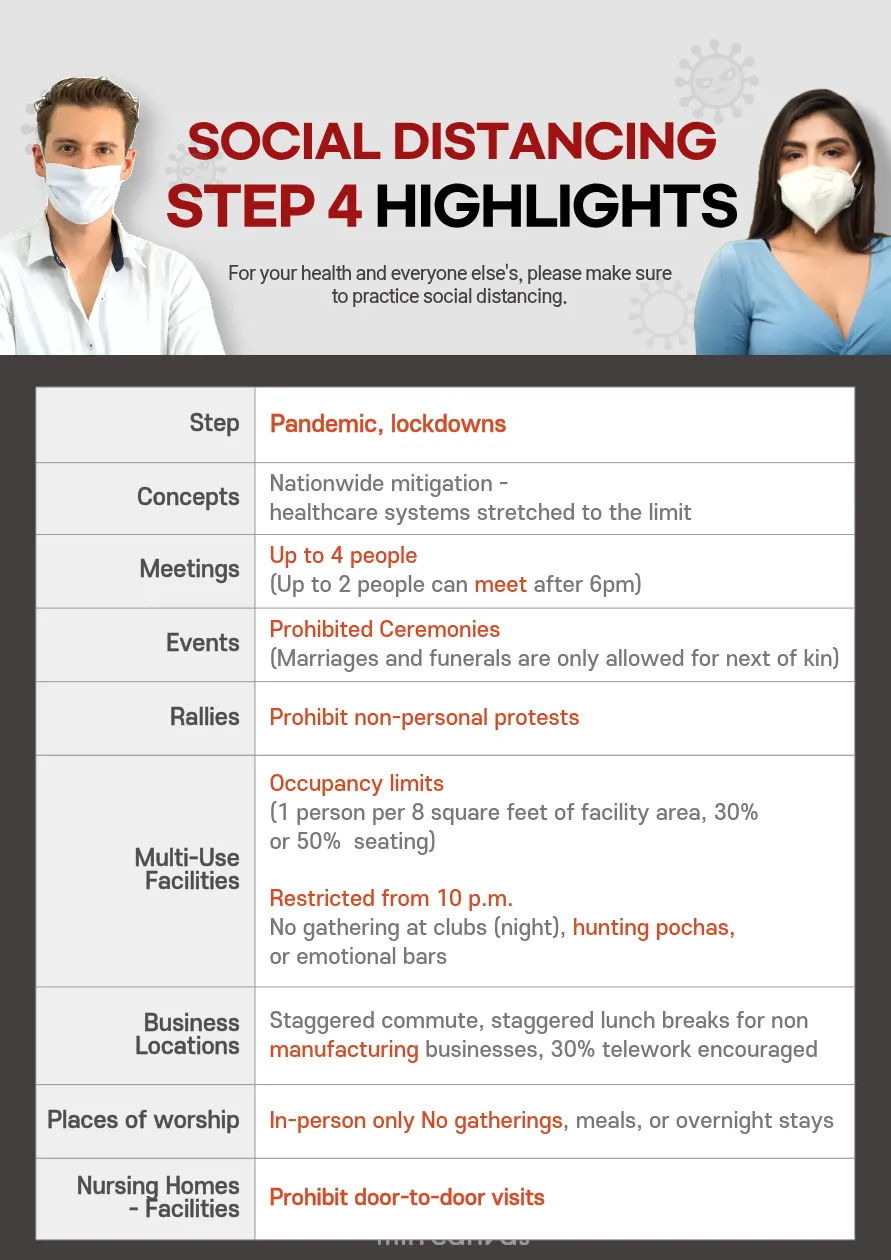
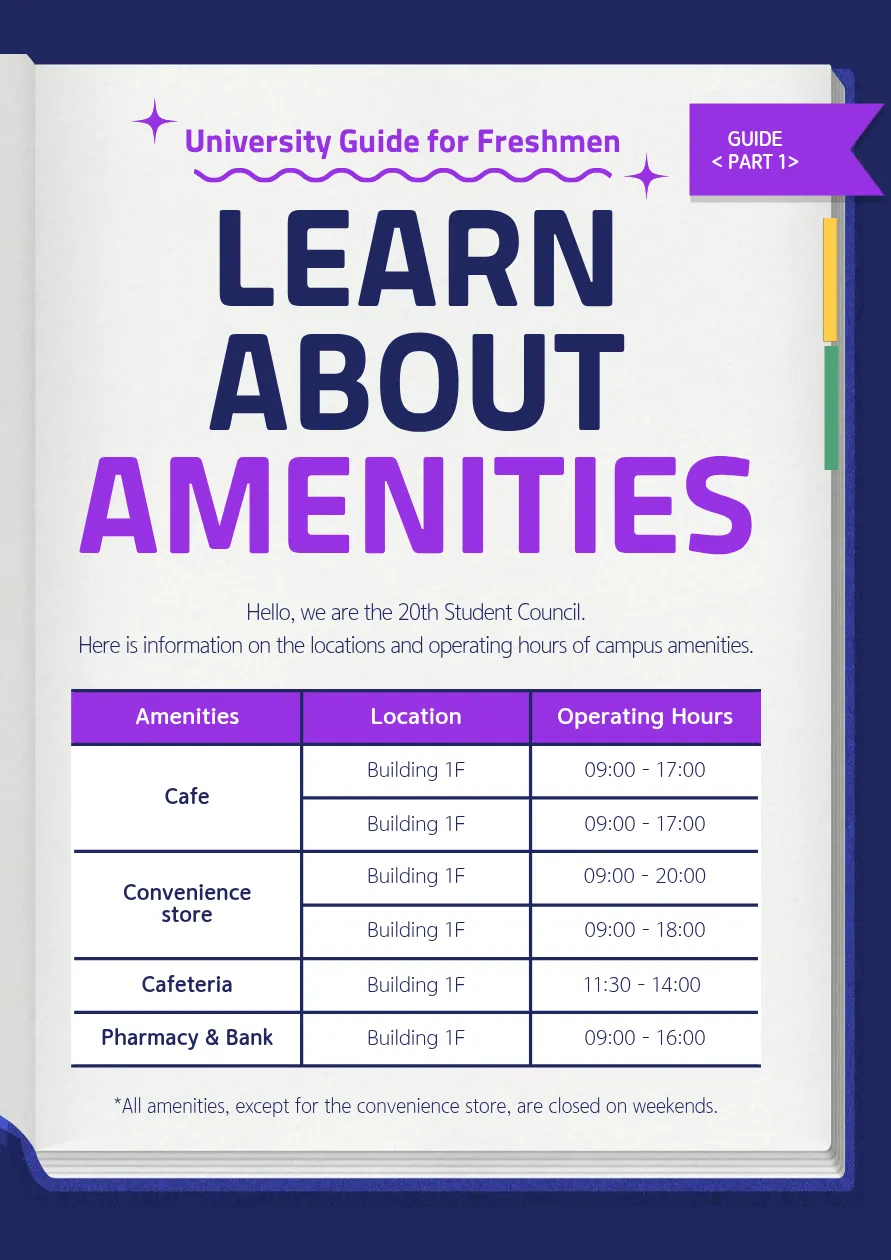

Pick a template you like and just enter your data. You'll get a great-looking table without spending time on design.
Start free in MiriCanvas.



