



Venn Diagram Maker: Make Venn Diagrams With Professional Design

Comparing two or more things? Just fill in what they share and where they differ, and the relationship shows at a glance. Pick a template in MiriCanvas or search for an illustration style you like, and put your Venn diagram together right away. Fill in your content and refine the colors, and you'll have a result that's ready to use in a presentation or report.

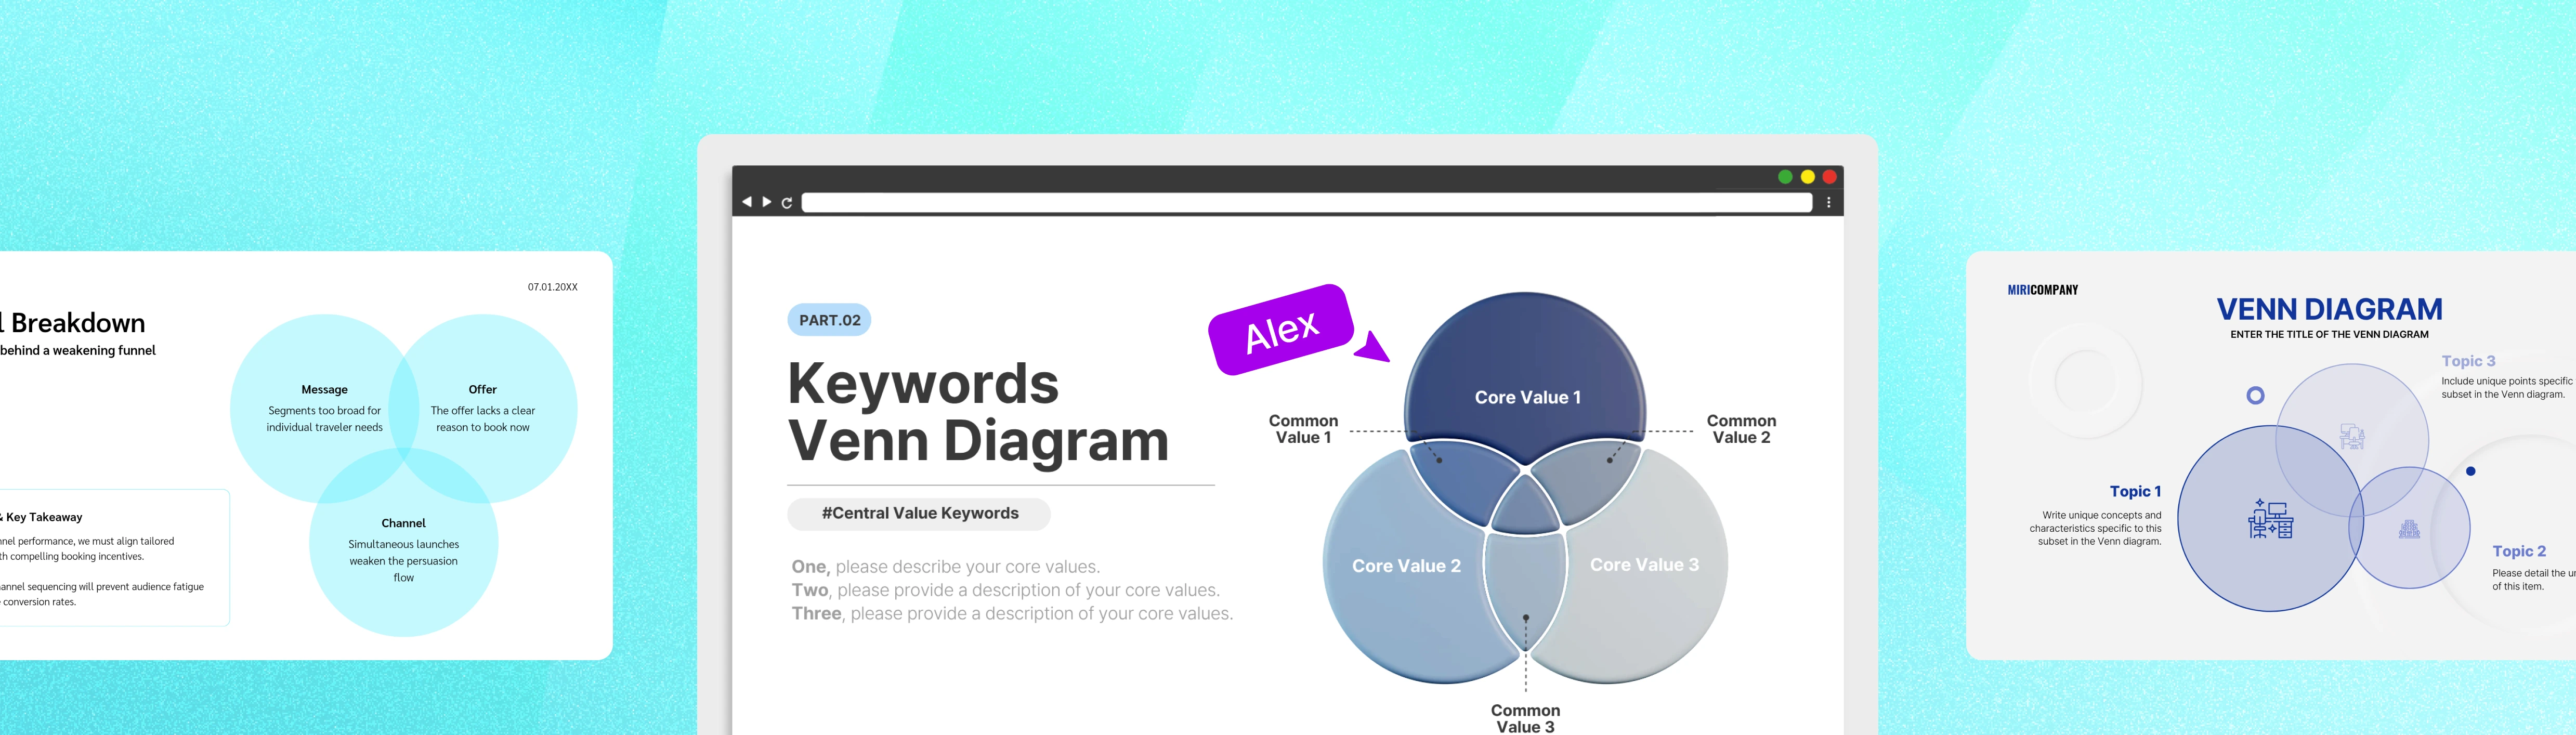
Miricanvas Venn diagram templates displayed across a browser mockup, showing a "Keywords Venn Diagram" slide with three overlapping circles for Core Value 1, 2, and 3, flanked by a funnel breakdown Venn diagram on the left and a multi-topic Venn diagram template on the right.

The MiriCanvas Venn Diagram Maker

New to making a Venn diagram? No problem. There's nothing to learn first, just pick the way you want to start.

Start Fast With Templates for Many Diagram Types

Get a Polished Look With Expert-Made Templates and Elements

Edit Everything From Colors and Fonts to the Number of Circles

Drop It Into Any Presentation or Report

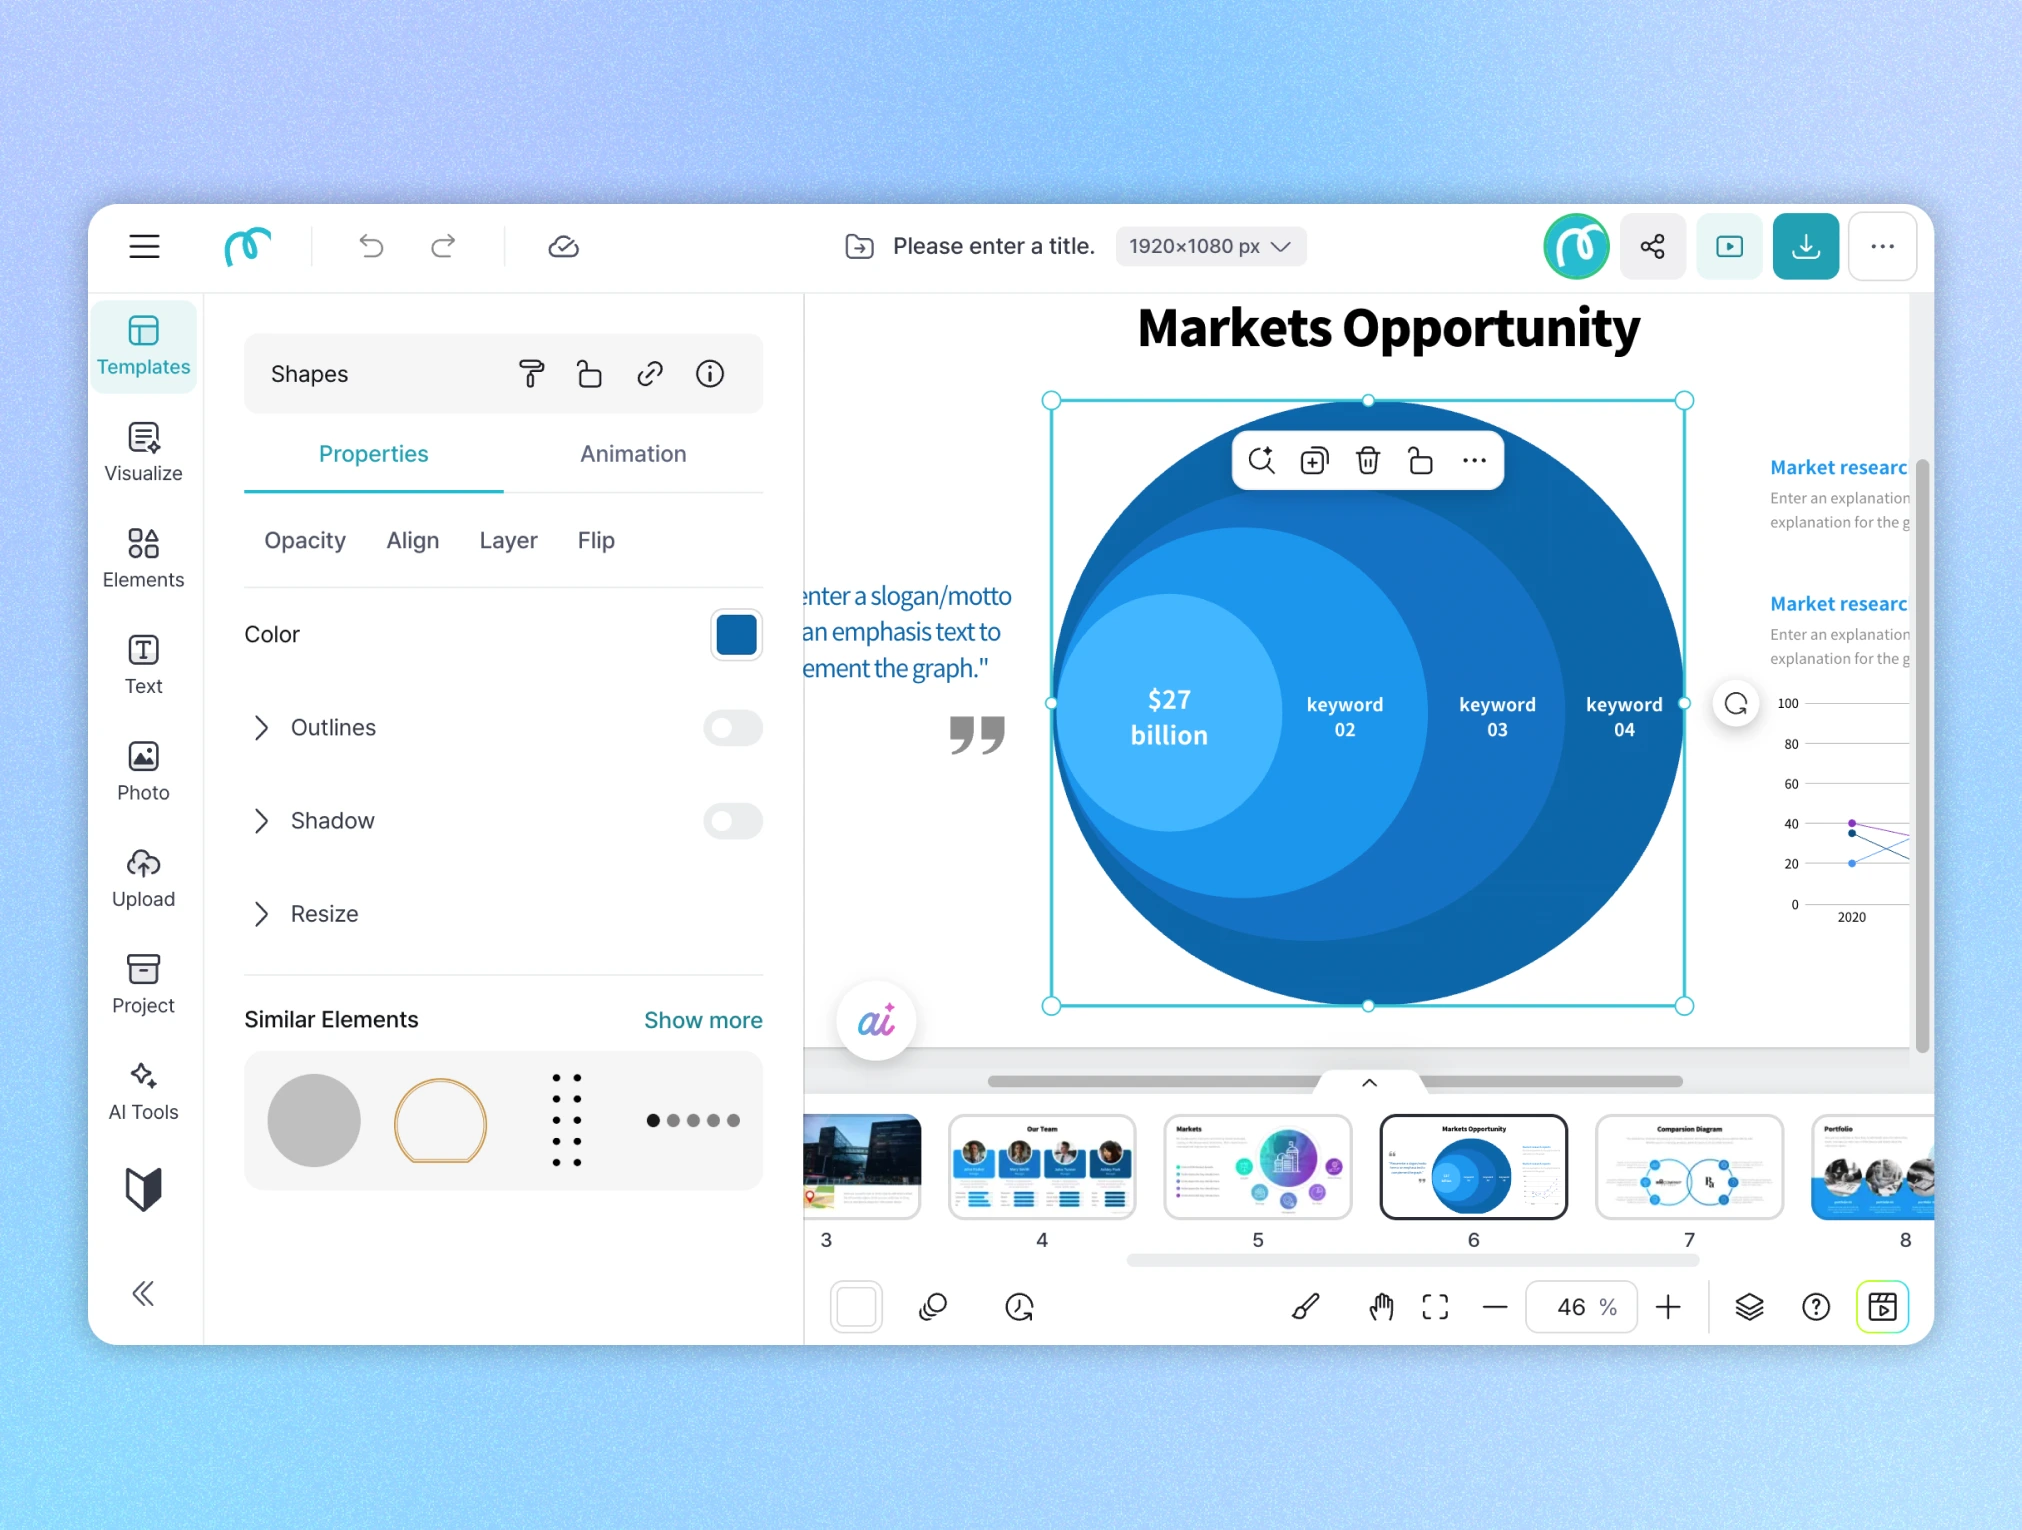
Miricanvas editor screen showing a "Markets Opportunity" slide with a Venn diagram of overlapping blue circles labeled $27 billion, keyword 02, keyword 03, and keyword 04, with a shapes properties panel open on the left and market research text and a line chart on the right.

How to Make a Venn Diagram

1

Add a Venn diagram

Start from a template: Search "Venn diagram" in the [Templates] menu on the left and pick a design you like. It's a fast way to start when you need to match a specific format, like a presentation or report.

Start from an illustration or element: In the [Elements] menu on the left, search "Venn diagram" or "3 circles" under the [Illustration] tab or across all tabs, then pick the style you want. Filters like Suitable, Recolorable, 3D, and Hand-drawn help you narrow it down.

Draw it yourself with shapes: Go to [Elements]>[Shapes] and place circles on the canvas to build the structure from scratch. You can freely adjust the size and position of each circle, which works well when you want to represent a specific shape precisely.

Start from an infographic design: In the [Data (Chart)] menu on the left, search "Venn diagram," "circle," or "diagram" and pick the design you want.
2

Enter set names and content

Click on the added Venn diagram to immediately enter text. Label each circle with the name of the item to be compared, and fill in the content corresponding to each set. In the overlapping intersection area of the two circles, enter elements that both items have in common.

3

Edit colors and design

Adjust the color and transparency of each circle so the overlapping area reads naturally. You can set text font, size, and alignment item by item in the settings panel. Recoloring a single circle to highlight it, or adjusting the transparency of an overlap, takes just a few clicks.

4

Add graphic elements

Once the structure and colors are set, add illustrations, icons, frames, shapes, and lines to finish the design. When you want to emphasize a certain area or point to something specific, even one added element can lift the result.

5

Download and share

Export your finished Venn diagram as PNG, JPG, PDF, PPTX, and more. Drop it straight into a presentation, or share it with a link.

What Is a Venn Diagram?

A Venn diagram is a visualization tool that represents two or more sets as circles, using the overlapping areas to show what items have in common.

It was devised in 1880 by the English logician John Venn, and was first used as a mathematical tool for expressing logical relationships between sets. Today it goes well beyond math education, into marketing strategy analysis, business decision-making, lesson materials, and much more.

Text is good at explaining each item on its own, but it struggles to show how several items overlap and where they diverge at a glance. Whether you're comparing the features of two products, mapping the scope of three teams, or explaining the relationship between two concepts in class, a Venn diagram turns what you'd have to spell out in words into a structure you can simply show.

As your comparison adds more items, the number of circles grows with it, and the makeup of the overlapping areas changes too. Knowing what each area of a Venn diagram means helps you place your content more accurately.

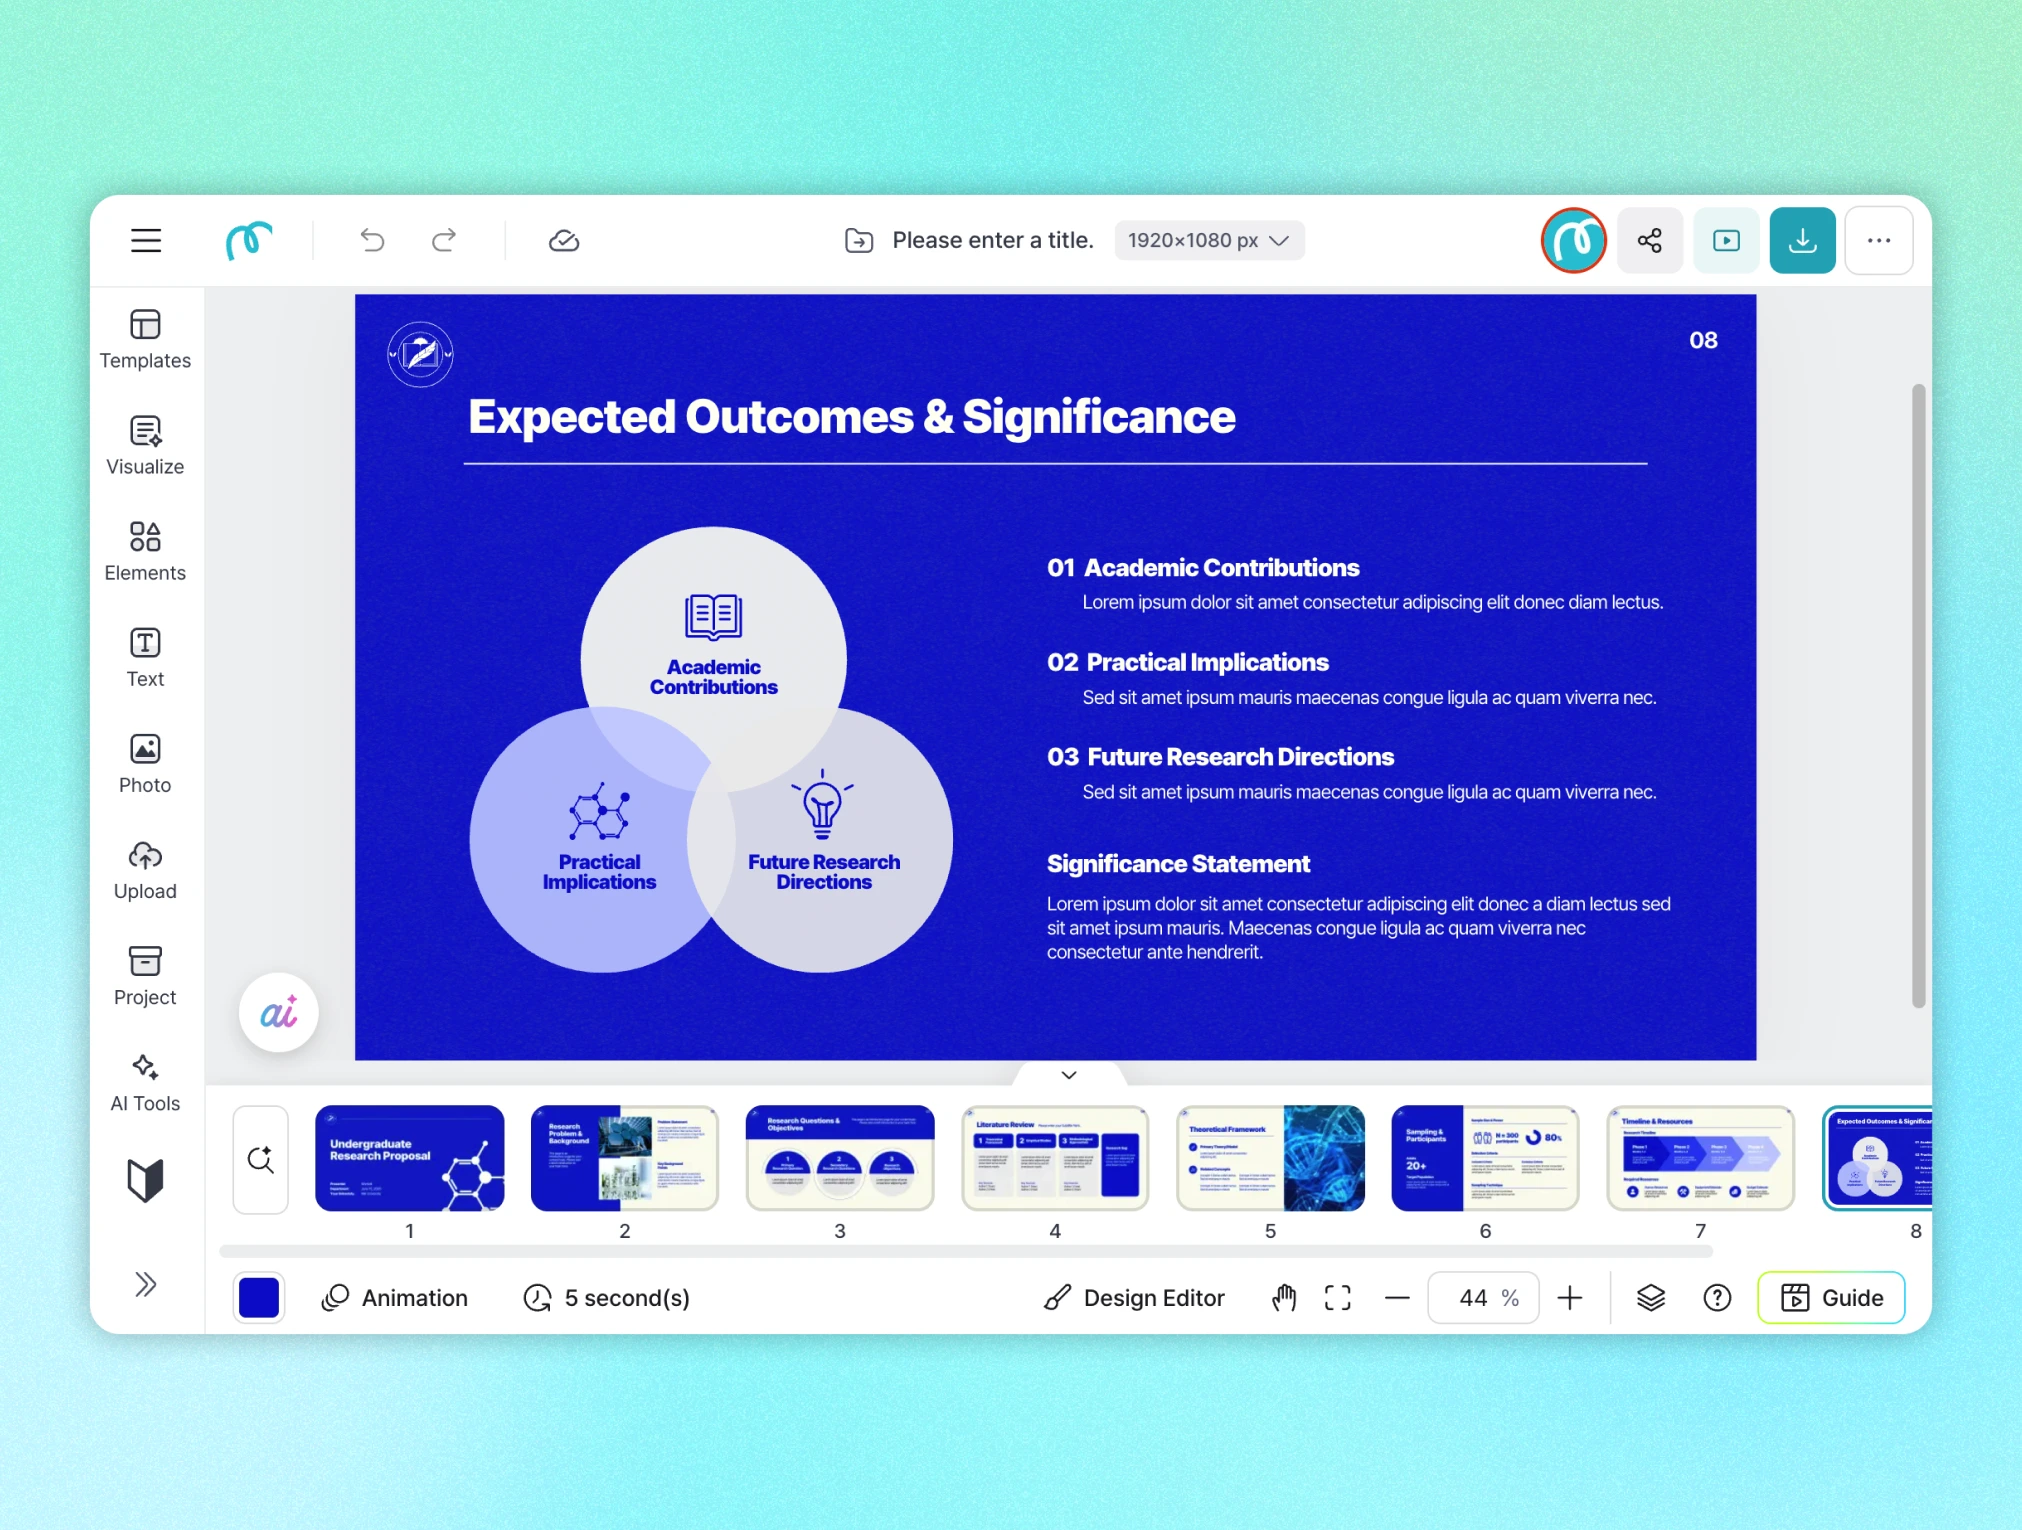
Miricanvas editor screen showing a blue "Expected Outcomes & Significance" slide with a Venn diagram of three overlapping circles for Academic Contributions, Practical Implications, and Future Research Directions, with corresponding text descriptions on the right.

The Parts of a Venn Diagram

A Venn diagram is split into a few areas, each carrying a different meaning. Knowing the parts helps you place your content in exactly the right spot.

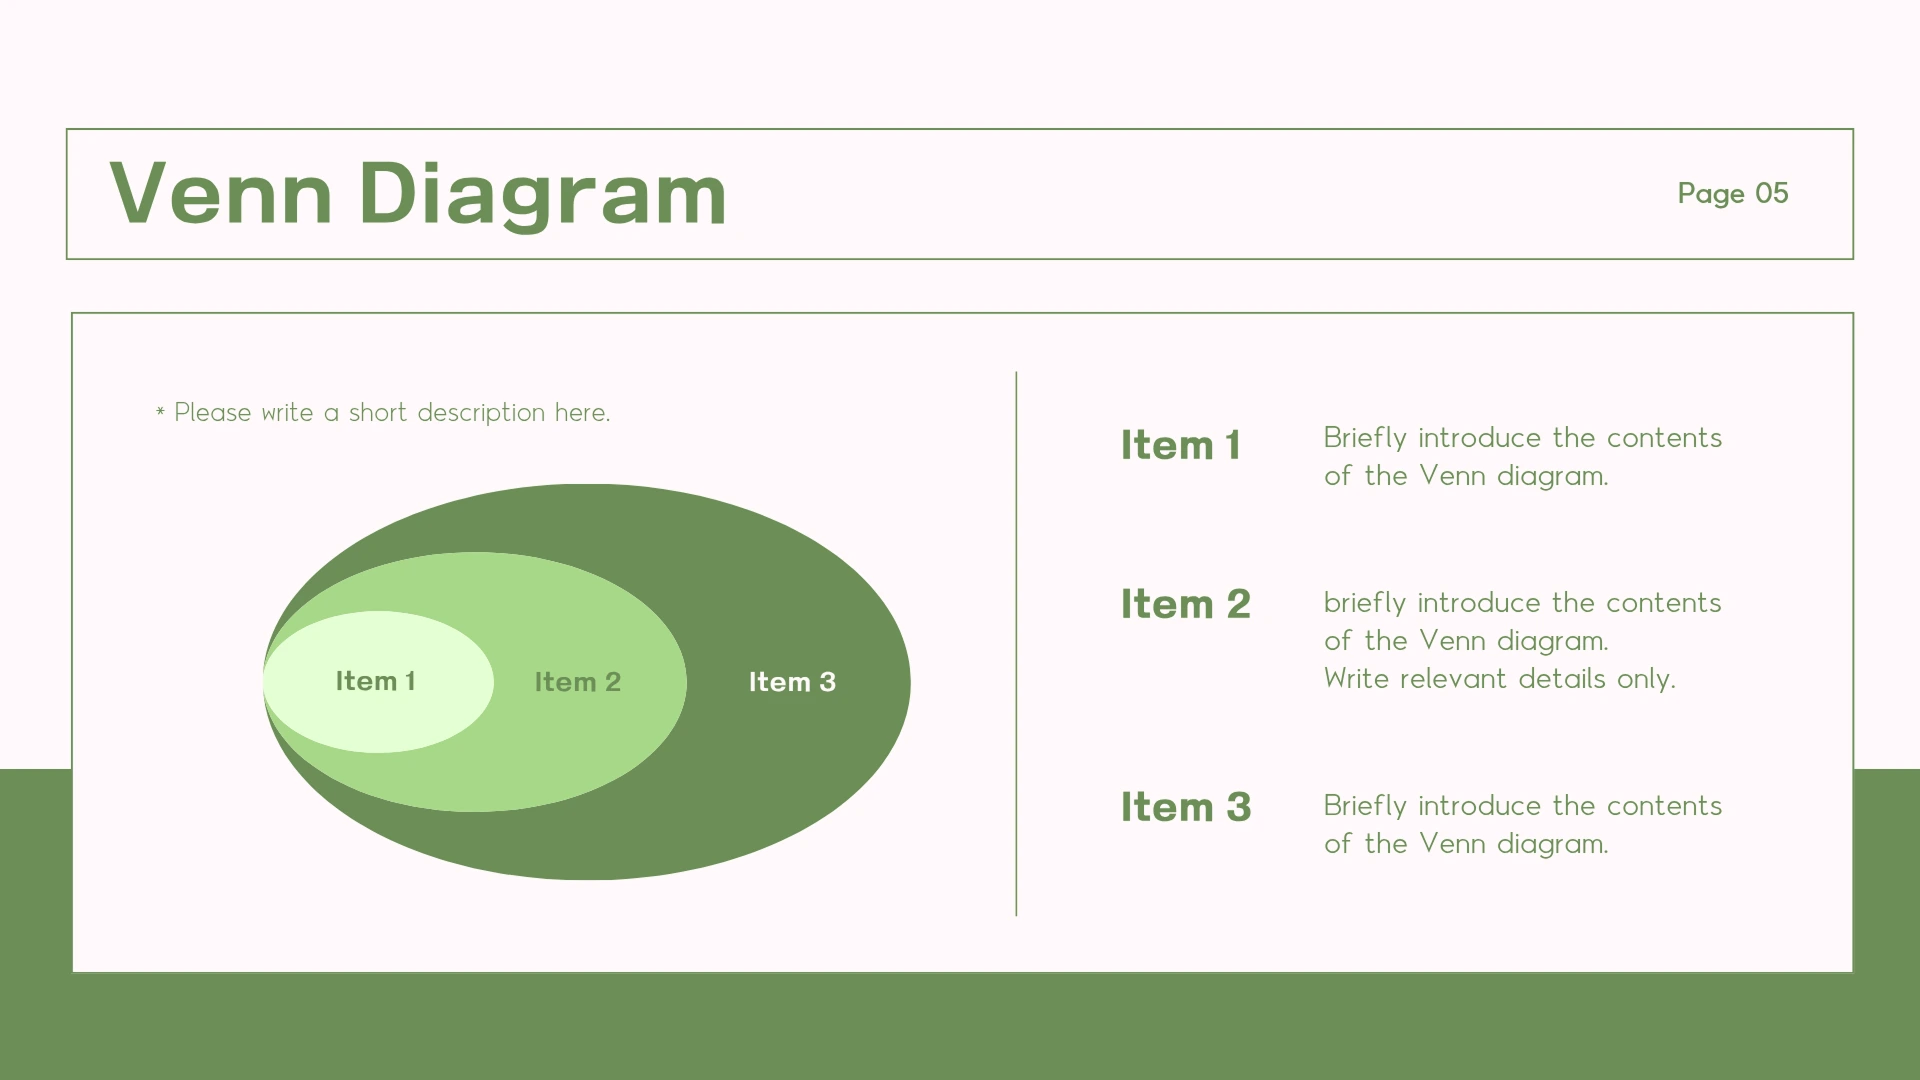
Miricanvas Venn diagram template titled "Venn Diagram, How We Tested It," showing a green nested-circle diagram with Item 1, 2, and 3 layered inside one another and corresponding descriptions on the right.

Circle (set)

Each thing you're comparing is shown as one circle. Inside a circle go the elements that belong to that set alone. Two items to compare means two circles; three means three.

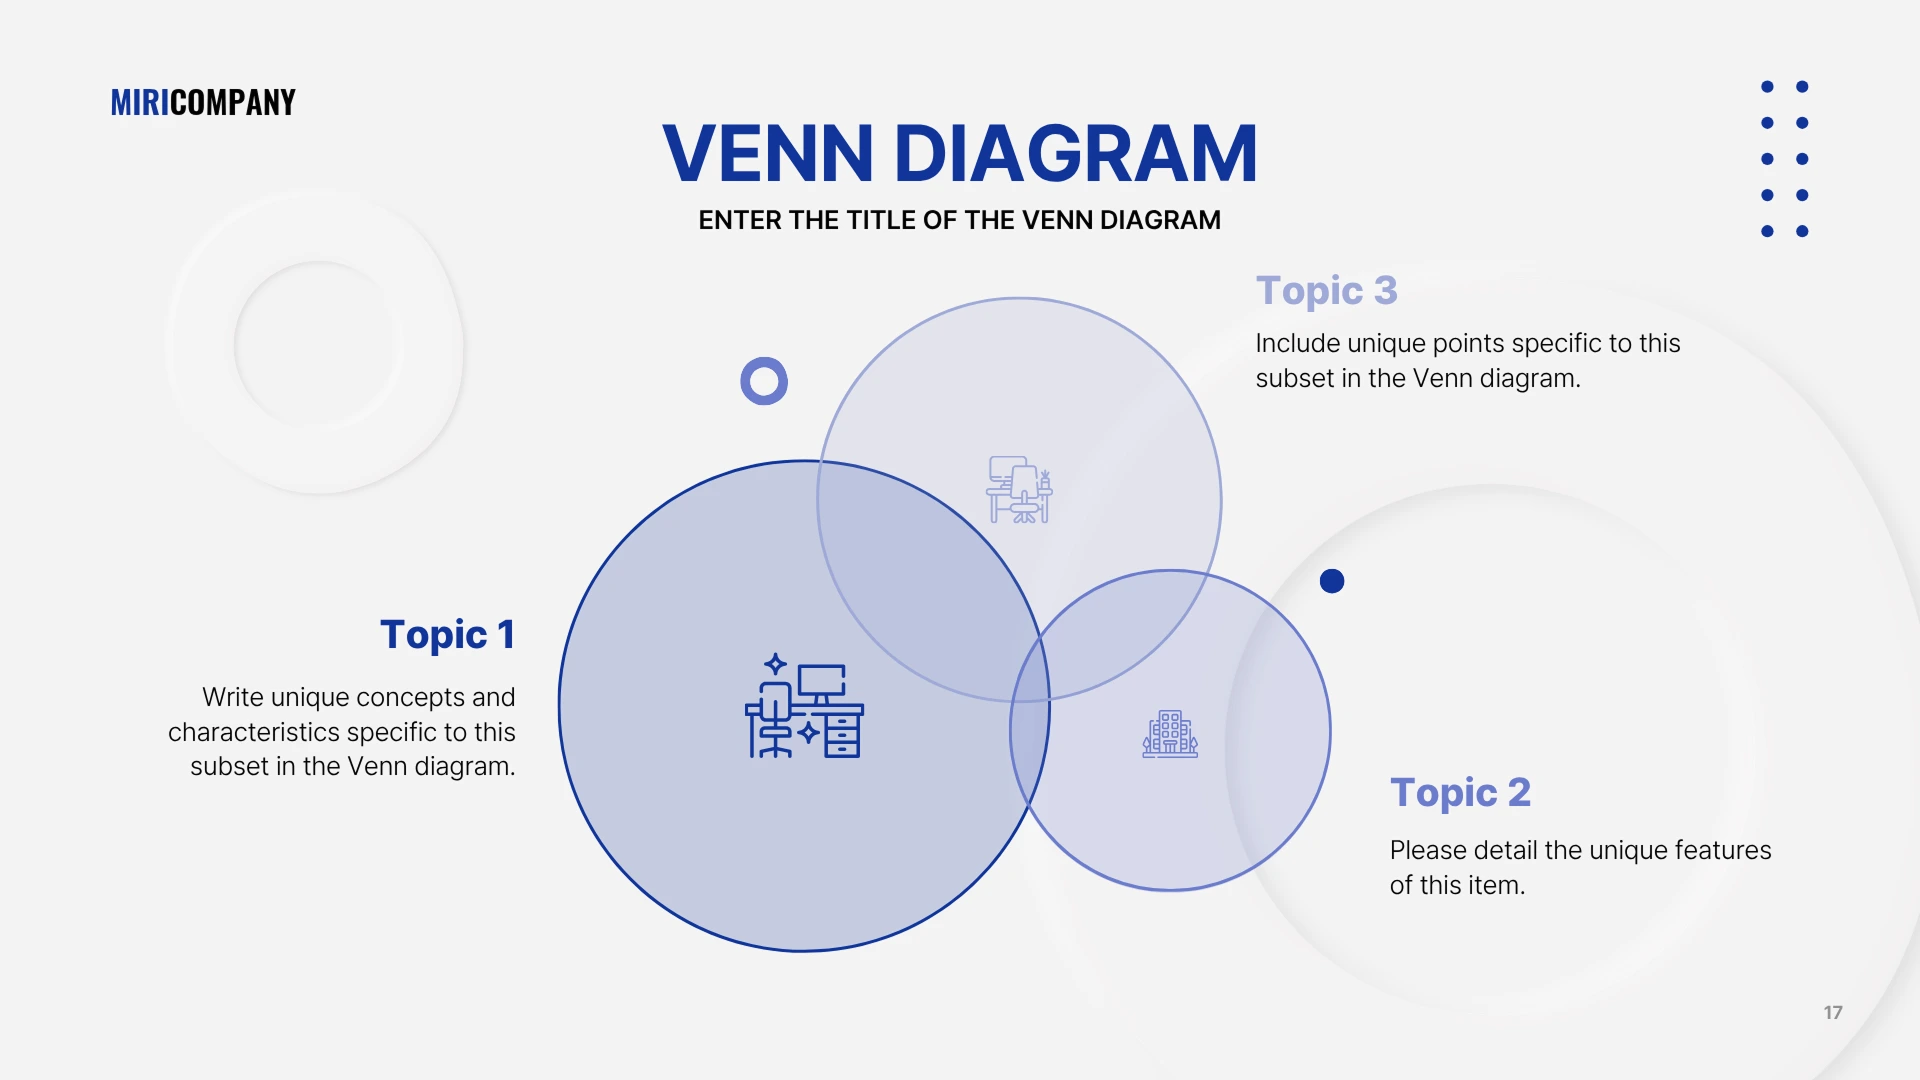
Miricanvas Venn diagram template titled "Venn Diagram, Enter the Title of the Venn Diagram," with three overlapping blue circles labeled Topic 1, 2, and 3, each paired with an icon and description text.

Intersection

The middle area where two circles overlap. Here you write the elements the two sets have in common. It's the most eye-catching area of a Venn diagram, showing what the compared items share at a glance.

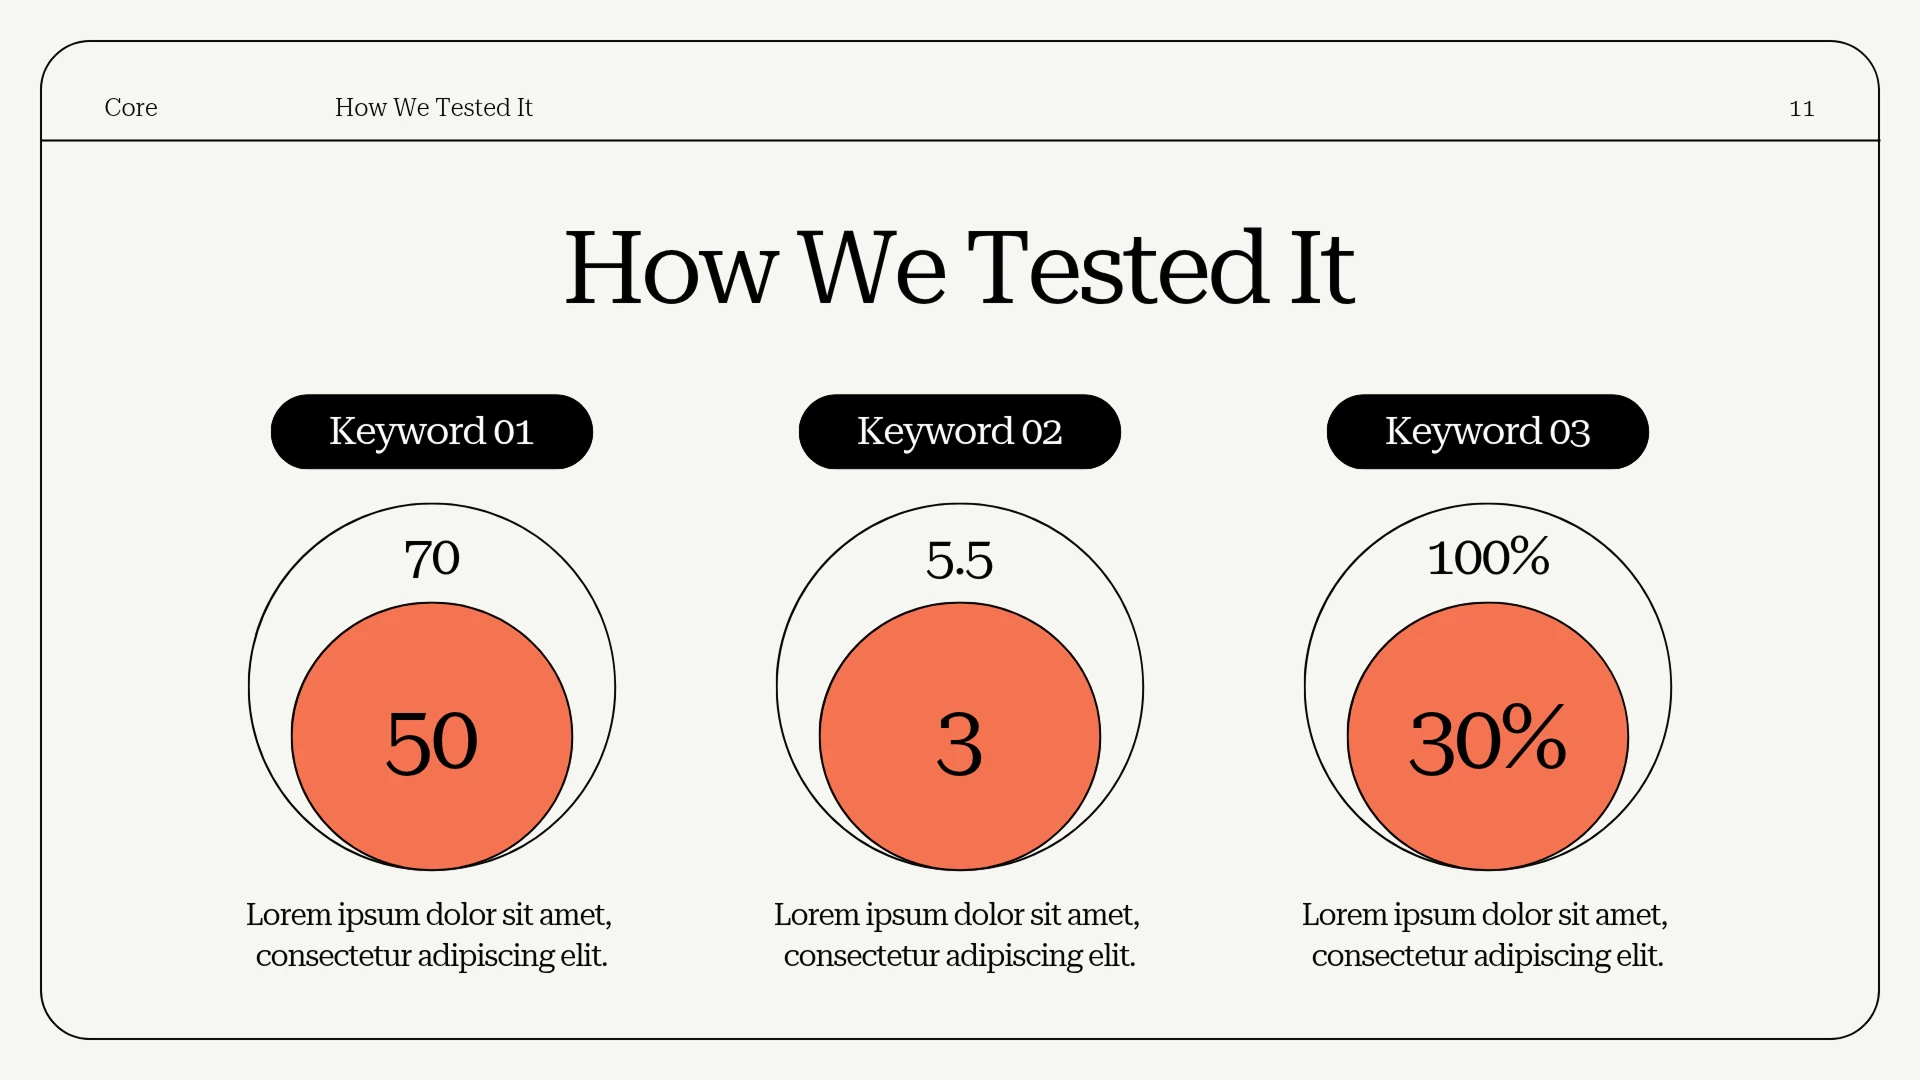
Miricanvas Venn diagram template titled "How We Tested It," showing three concentric-circle charts for Keyword 01 (70/50), Keyword 02 (5.5/3), and Keyword 03 (100%/30%), each with a description below.

Union

The whole area of all circles combined. Any element that belongs to even one of the sets is part of the union. It serves as the reference for the full range that covers everything you're comparing.

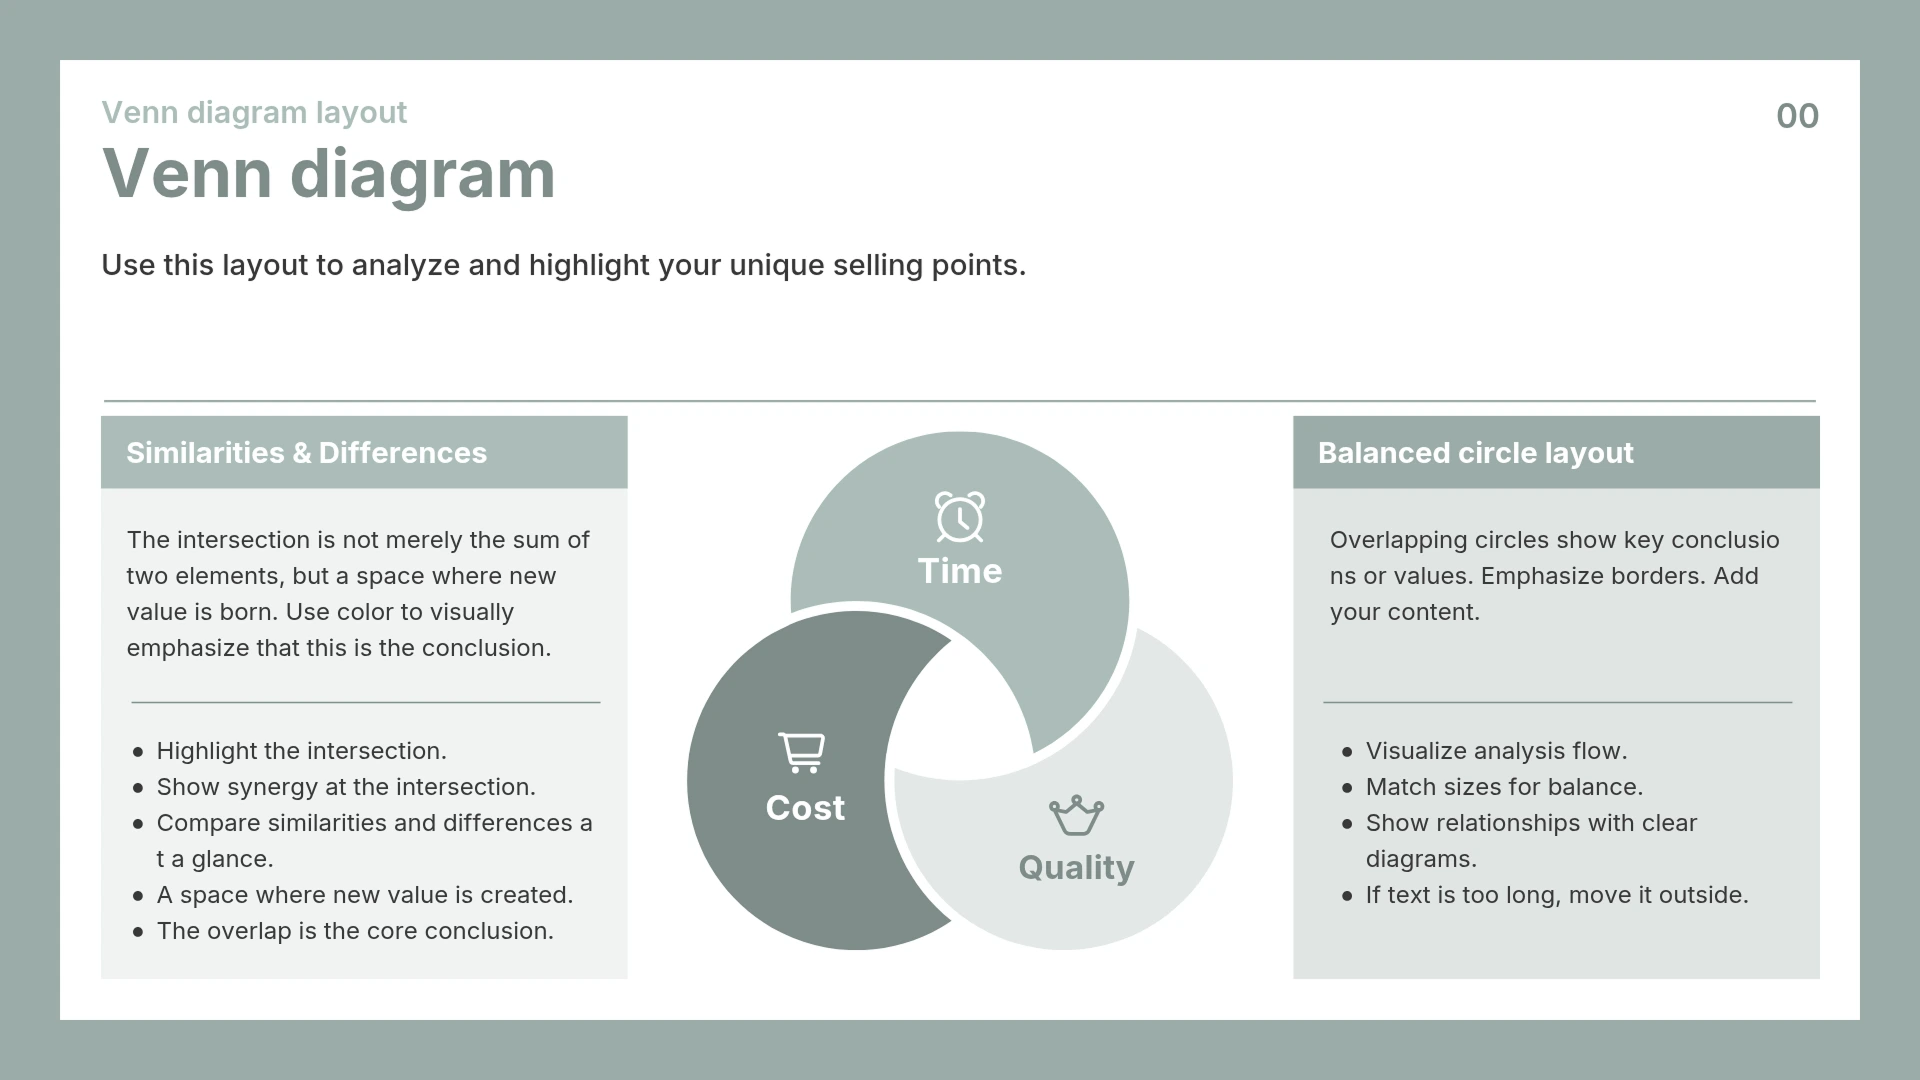
Miricanvas Venn diagram template titled "Venn diagram, Venn diagram layout," featuring a three-circle pinwheel diagram for Time, Cost, and Quality, with Similarities & Differences and Balanced circle layout descriptions on either side.

Universal set

The outer area surrounding the entire Venn diagram, usually drawn as a rectangle. It defines the range of all elements this diagram deals with. Elements that don't fall inside any circle can still exist within the universal set.

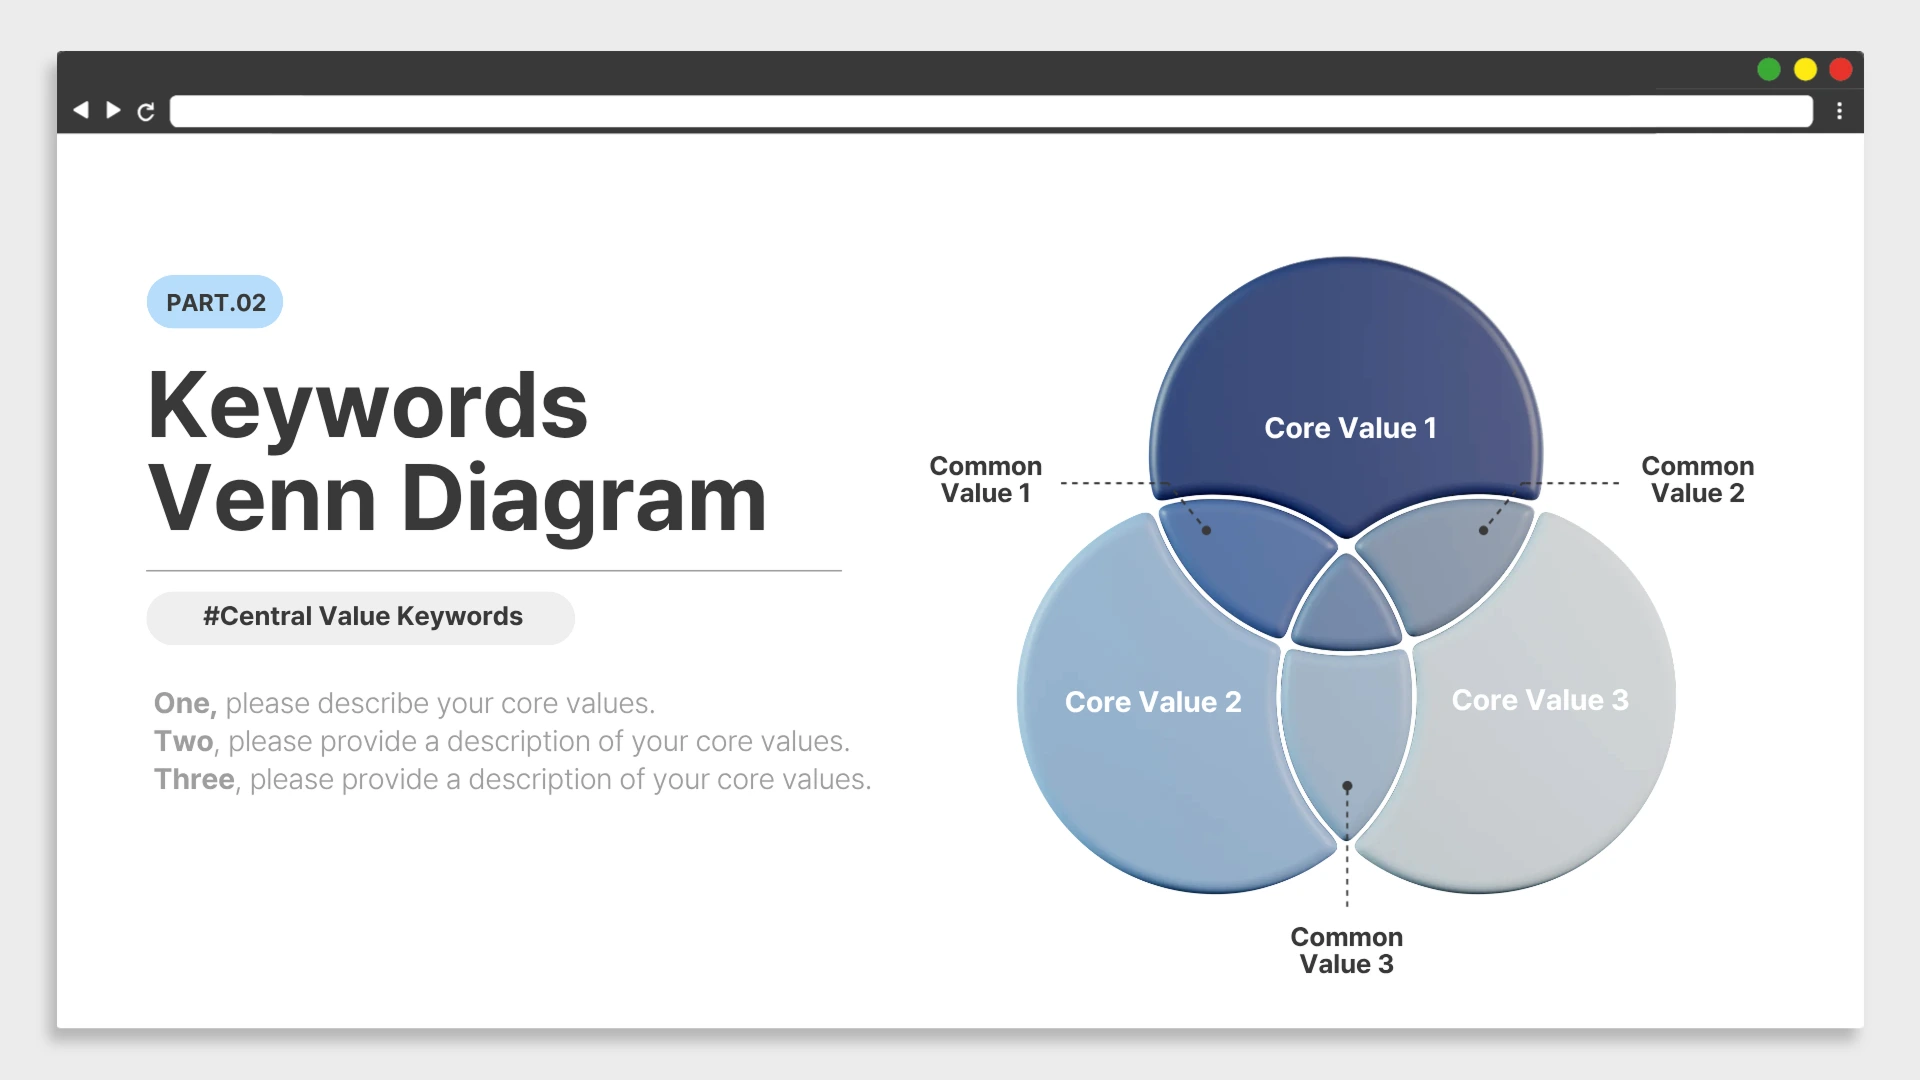
Miricanvas Venn diagram template shown in a browser window, titled "Keywords Venn Diagram," with three overlapping circles for Core Value 1, 2, and 3 and their intersecting Common Values labeled around the diagram.

Complement

The area of the universal set left after excluding a particular circle (set). For example, if a universal set contains A and B, the complement of A refers to all elements that don't belong to A.

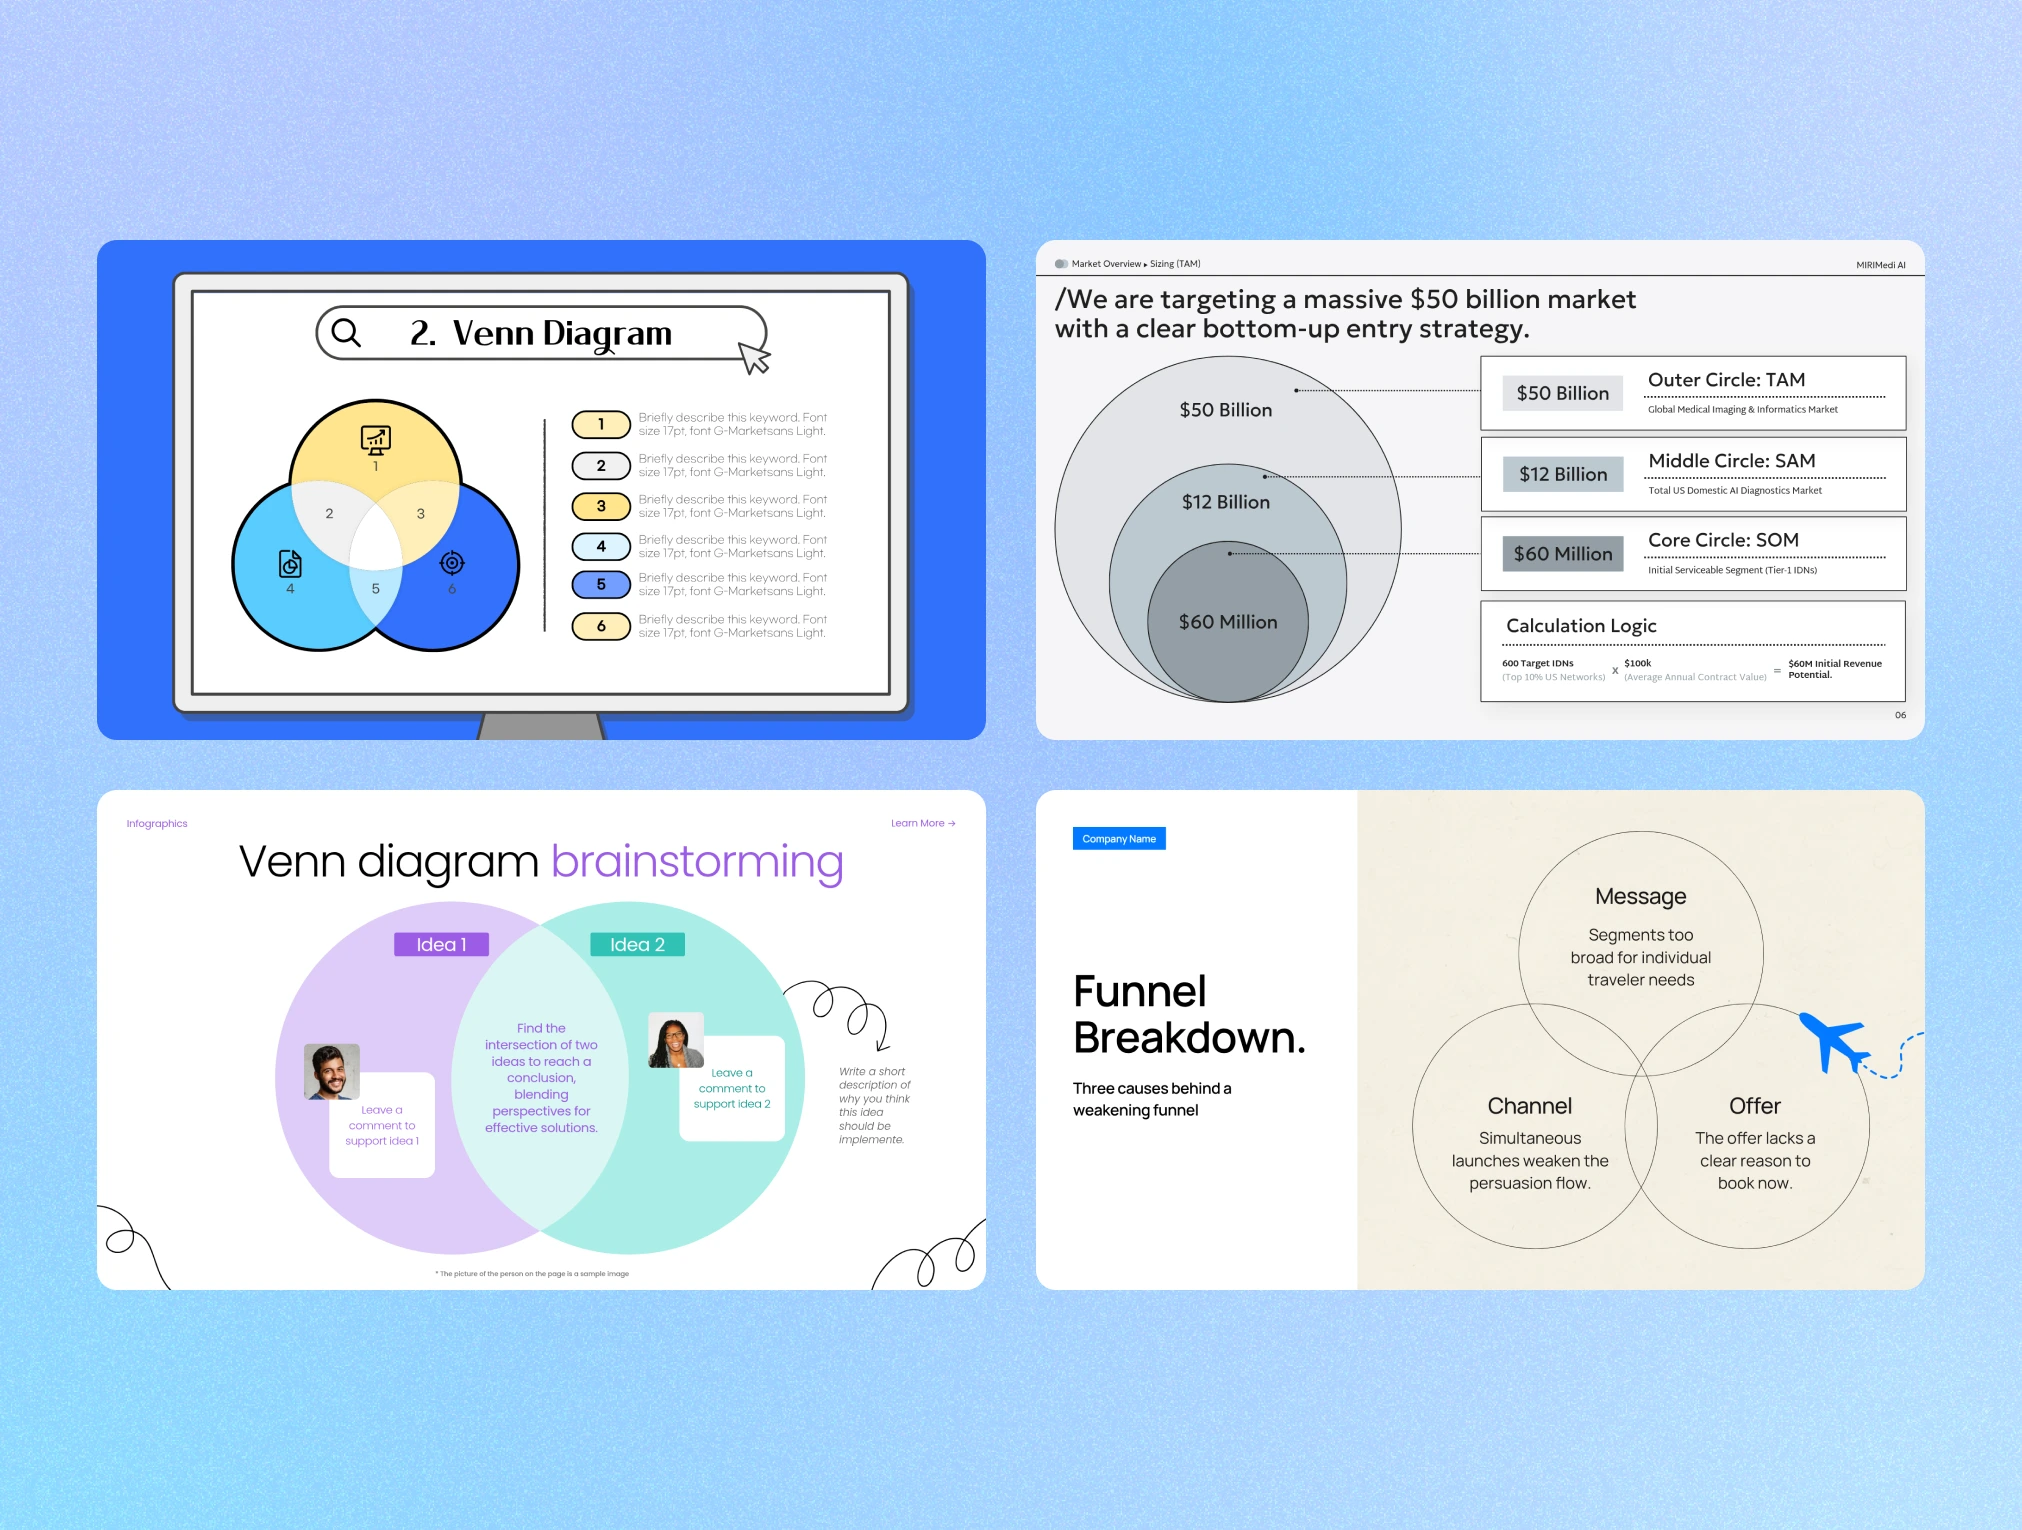
Four Miricanvas Venn diagram templates arranged in a 2x2 grid: a search result screen for "2. Venn Diagram" with a three-circle keyword Venn diagram on a monitor, a $50 billion TAM/SAM/SOM concentric-circle market overview slide, a two-circle "Venn diagram brainstorming" slide comparing Idea 1 and Idea 2, and a "Funnel Breakdown" slide with three overlapping circles for Message, Channel, and Offer.

Design Easily With Expert-Made Templates and Elements

You don't have to build from scratch. Pick a template and start editing right away, or search illustrations and elements to make a Venn diagram in the style you want. Narrow it down with style filters like 3D or Hand-drawn, and combine the design elements you like into a layout that's your own. Want to emphasize a certain structure or point? Add an icon or shape, and your message comes across more clearly.

Edit Everything From Colors and Text to Circle Size

Adjust the color and transparency of each circle, the style of the overlapping areas, and the font, size, and position of your text, all item by item. Recoloring a single circle to highlight it, or adjusting the transparency of an intersection so the overlap reads naturally, takes just a few clicks in the settings panel. There's nothing extra to learn, just select what you want to change.

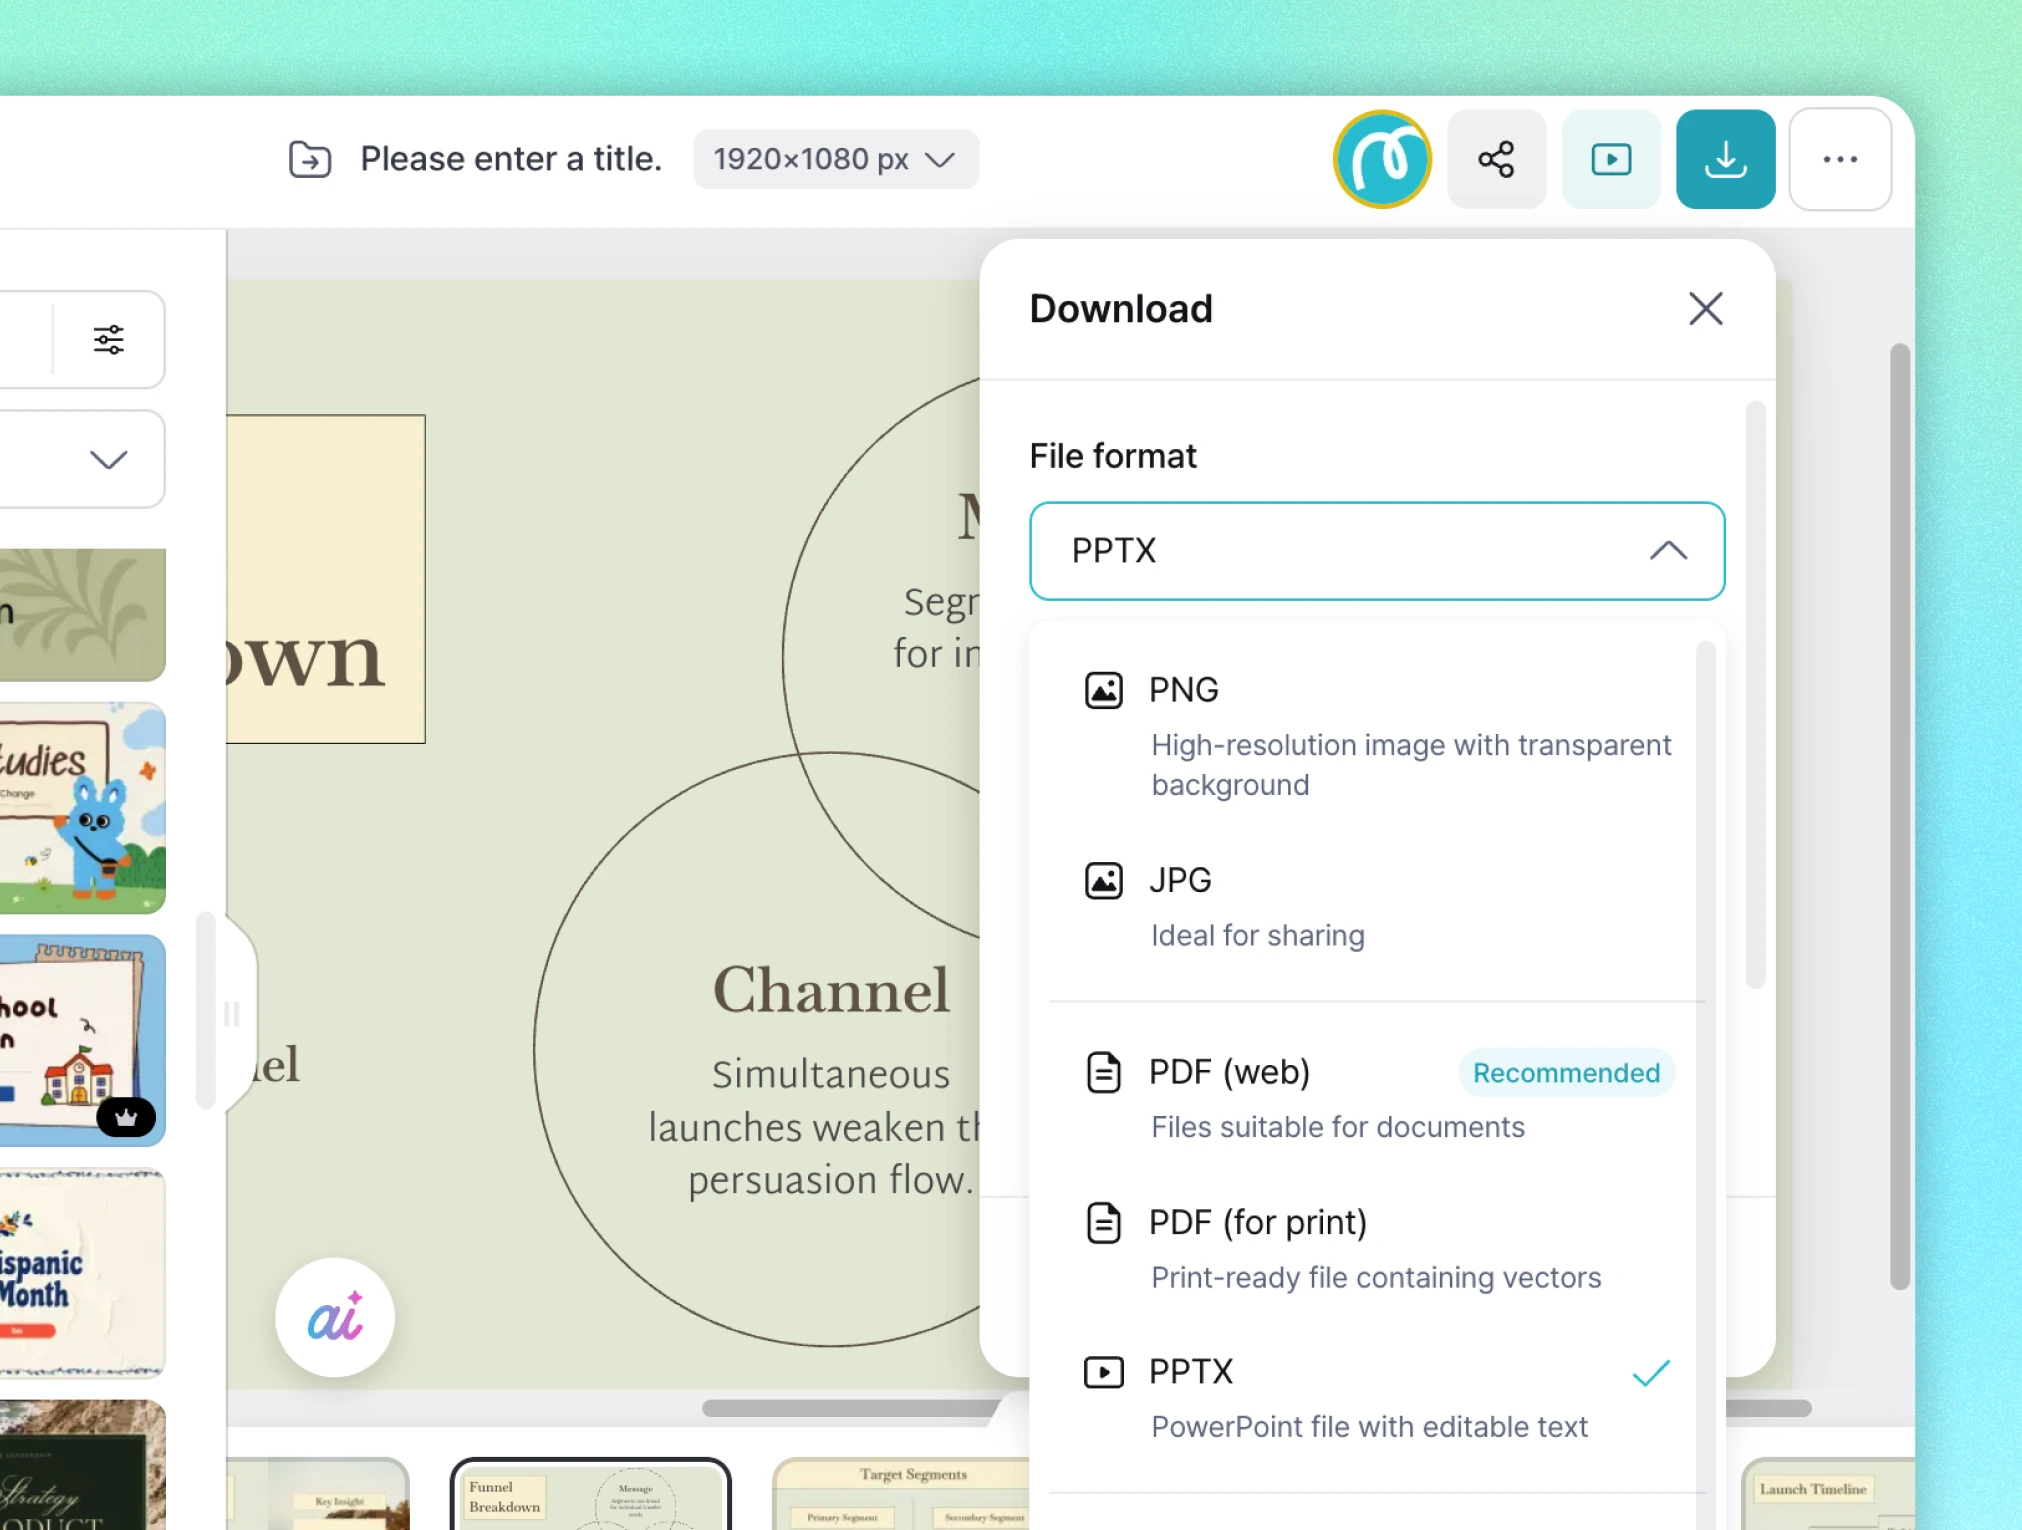
Miricanvas editor download menu open over a "Funnel Breakdown" Venn diagram slide with a Channel circle visible, showing file format options PNG, JPG, PDF (web), PDF (for print), and PPTX, with PPTX selected.

Drop Your Finished Venn Diagram Straight Into a Presentation or Report

Export your finished Venn diagram as PNG, JPG, PDF, PPTX, and more, right away. Export to PPTX and open it directly in PowerPoint to drop it straight into a presentation slide. Sharing with a link or printing works too, with no separate conversion step. From making it to putting it to use, you can finish in one place.

Venn Diagram Templates You Can Use Right Now

Pick a template that fits your purpose and style, and start right away. Every template stays fully editable, content and design alike, after you bring it in.

Miricanvas Venn diagram template titled "Venn diagram, Venn diagram layout," featuring a three-circle pinwheel diagram for Time, Cost, and Quality, with Similarities & Differences and Balanced circle layout descriptions on either side.
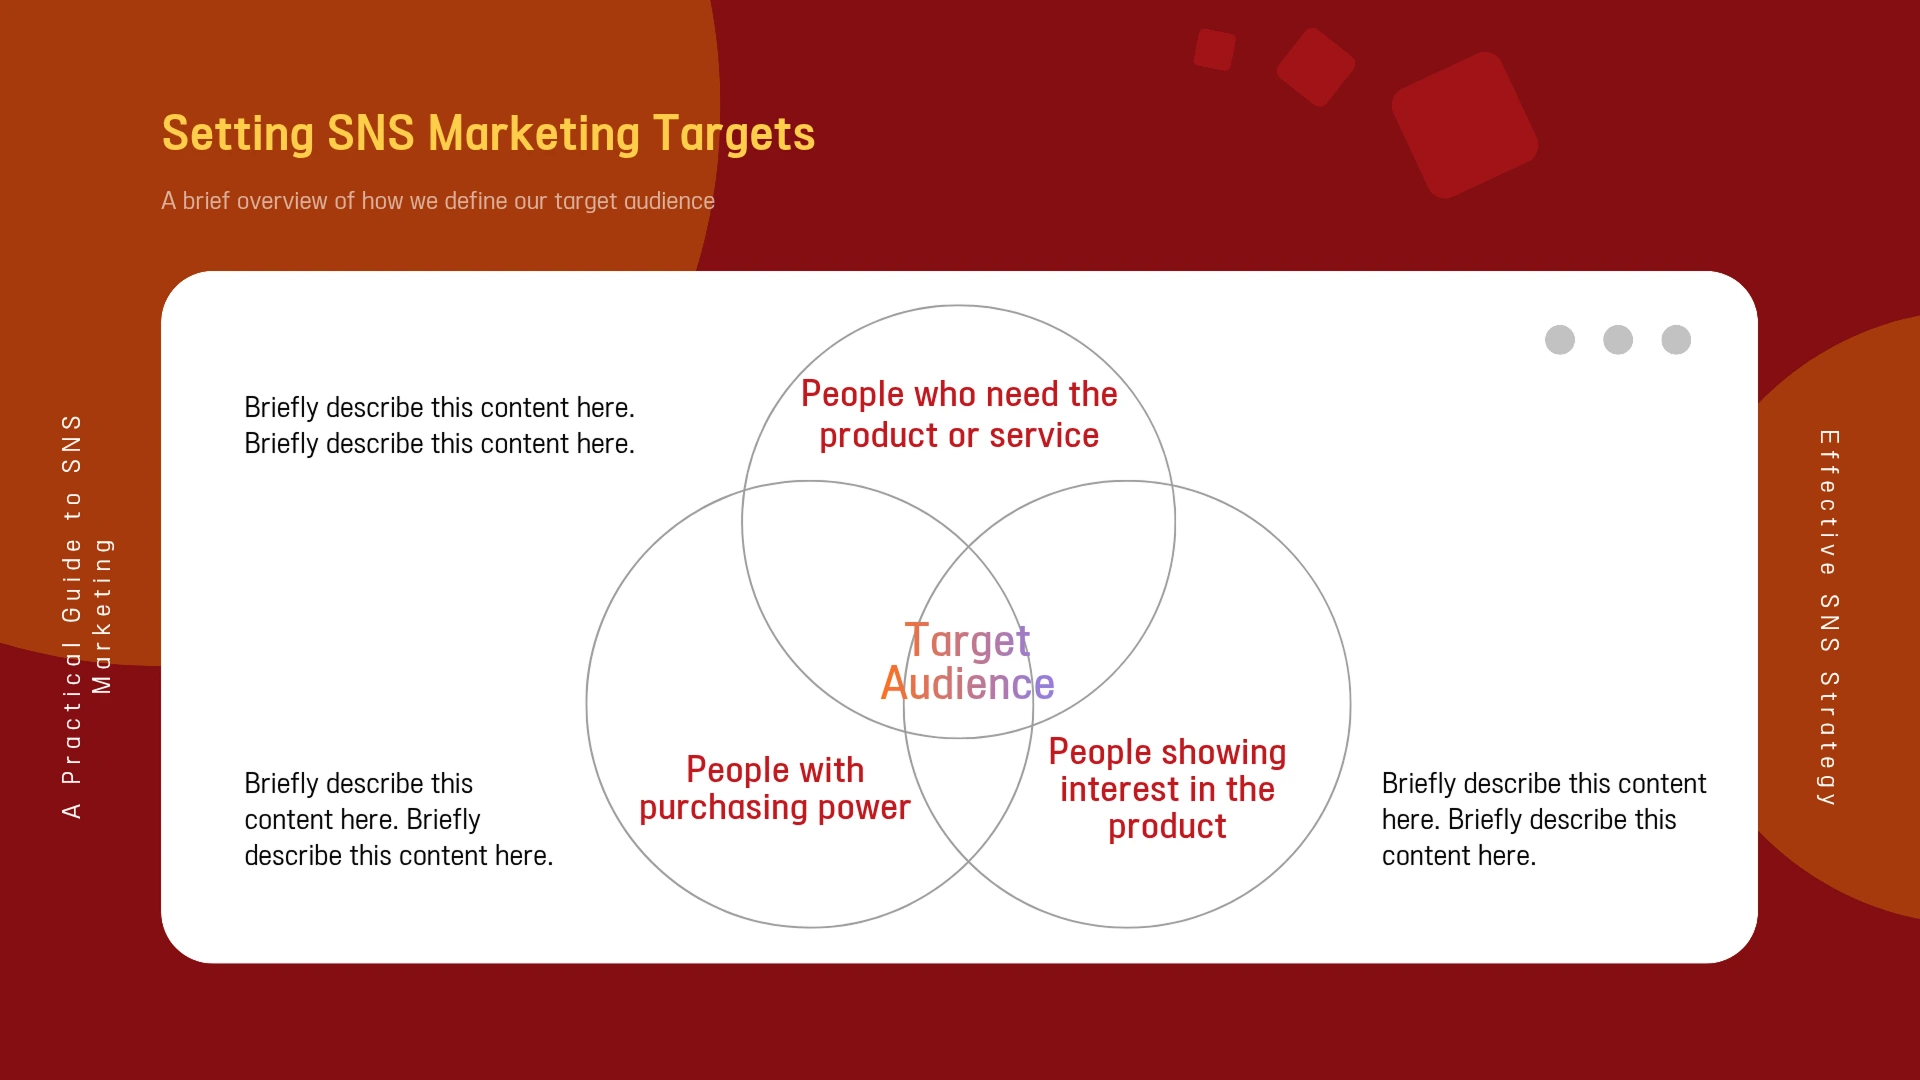
Dark red Miricanvas Venn diagram template titled "Setting SNS Marketing Targets," with three overlapping circles for people who need the product, people with purchasing power, and people showing interest, converging on a central "Target Audience" label.
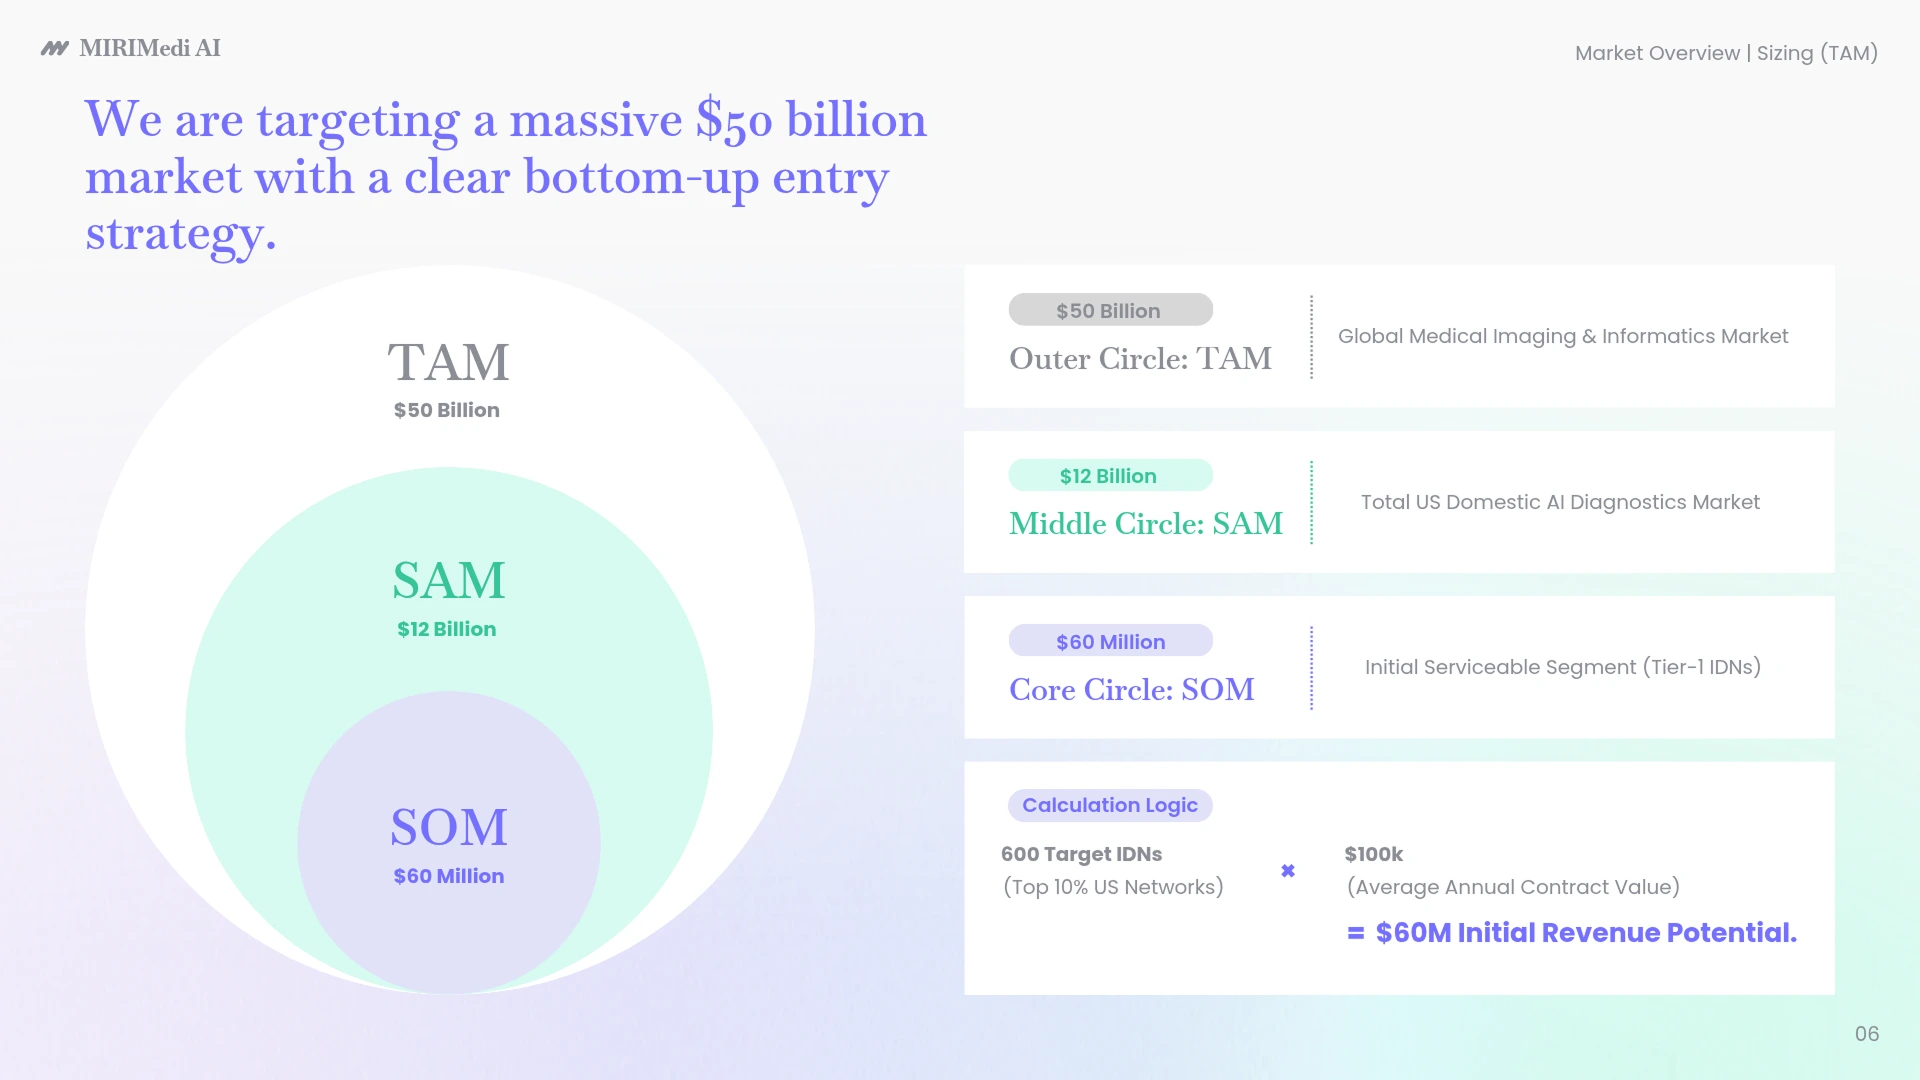
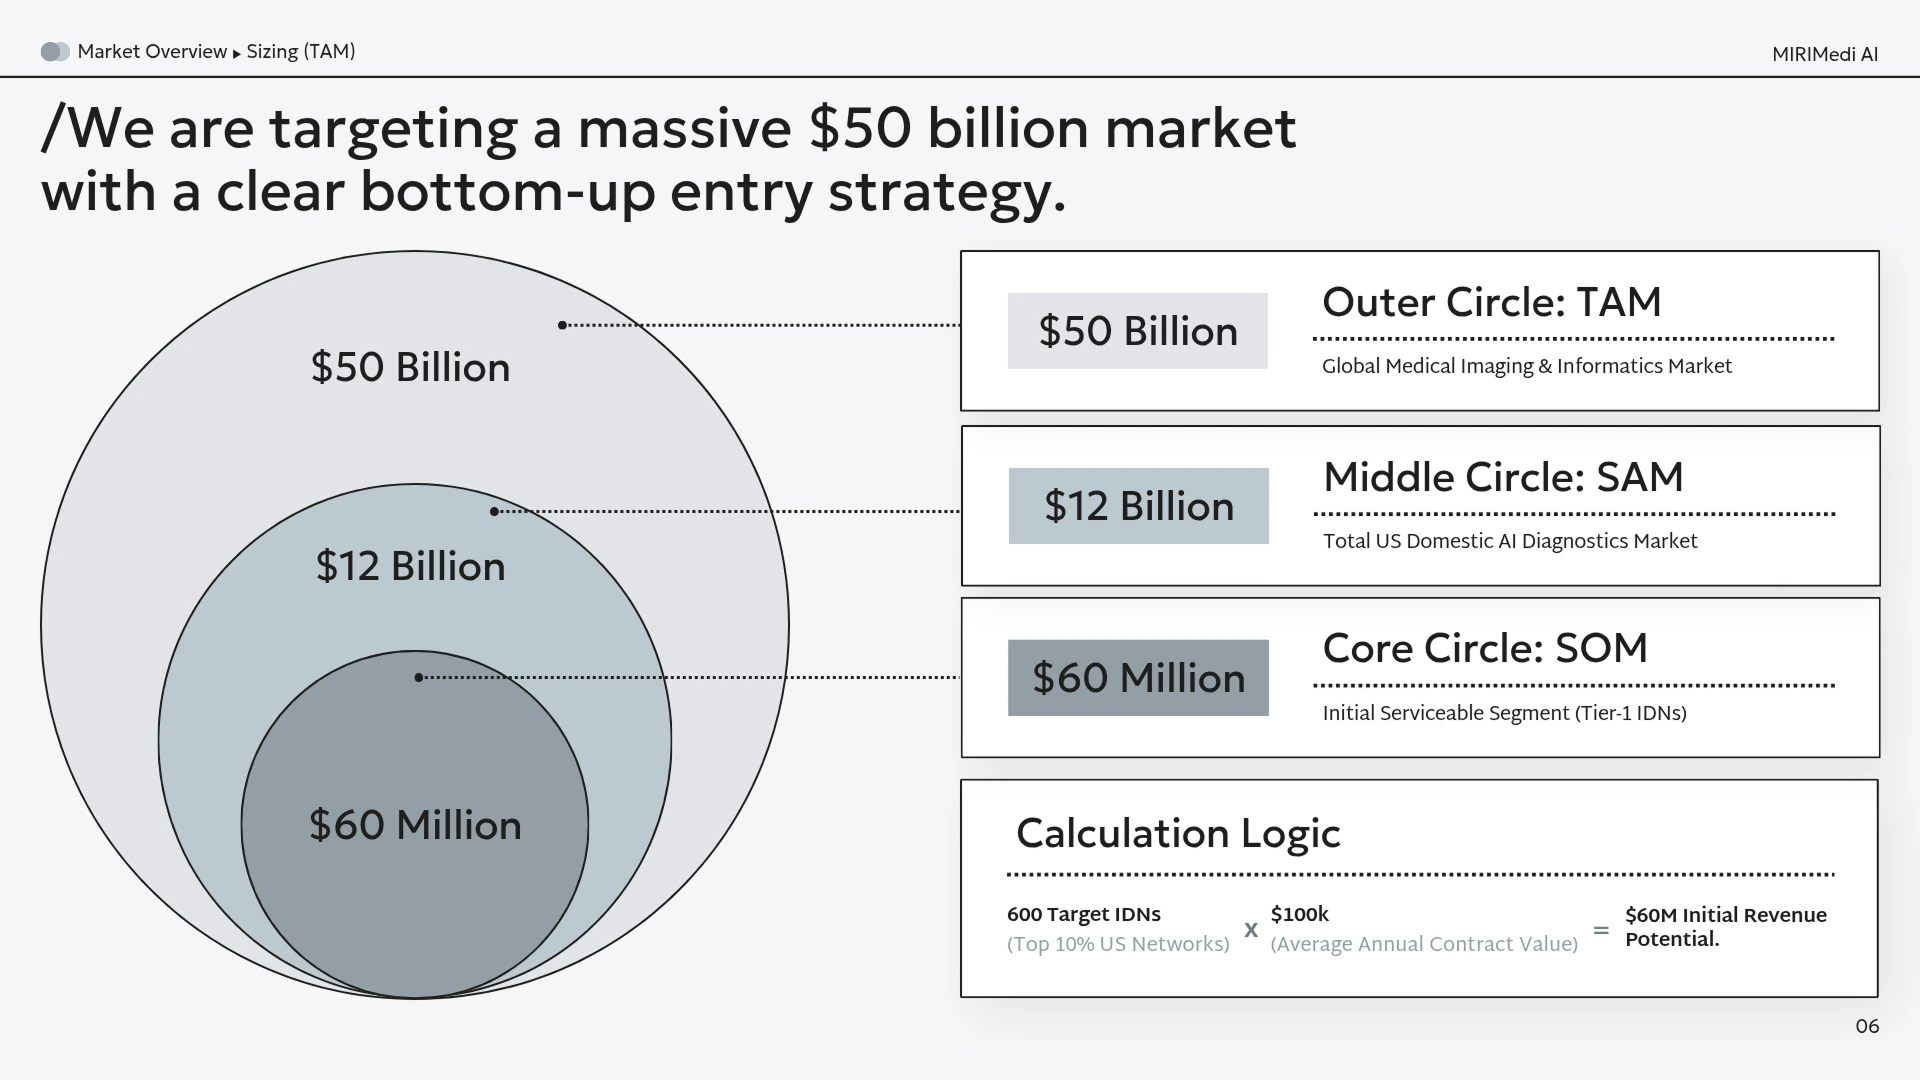
Miricanvas Venn diagram template with a TAM/SAM/SOM concentric-circle diagram showing $50 billion, $12 billion, and $60 million market tiers, paired with a breakdown table and calculation logic on the right.
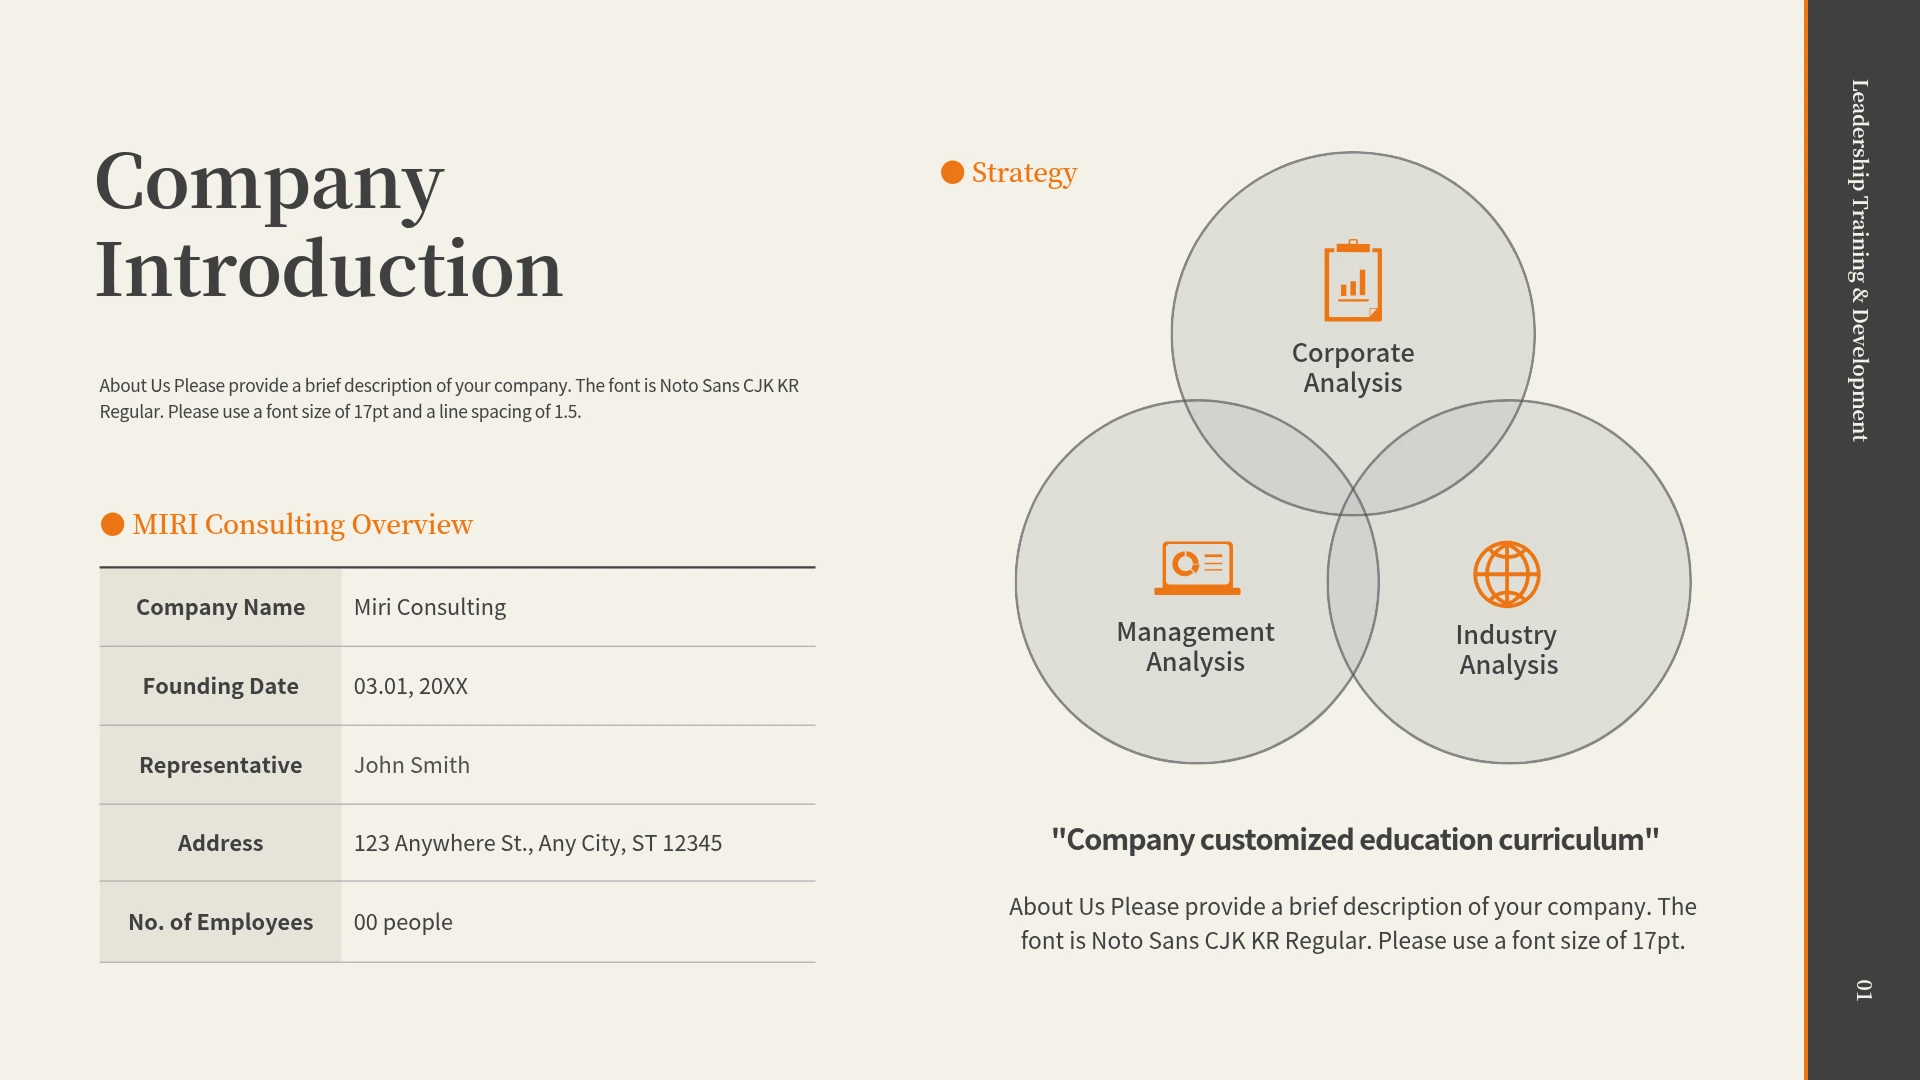
Miricanvas Venn diagram template titled "Company Introduction," with a three-circle Venn diagram for Corporate Analysis, Management Analysis, and Industry Analysis alongside a company information table.
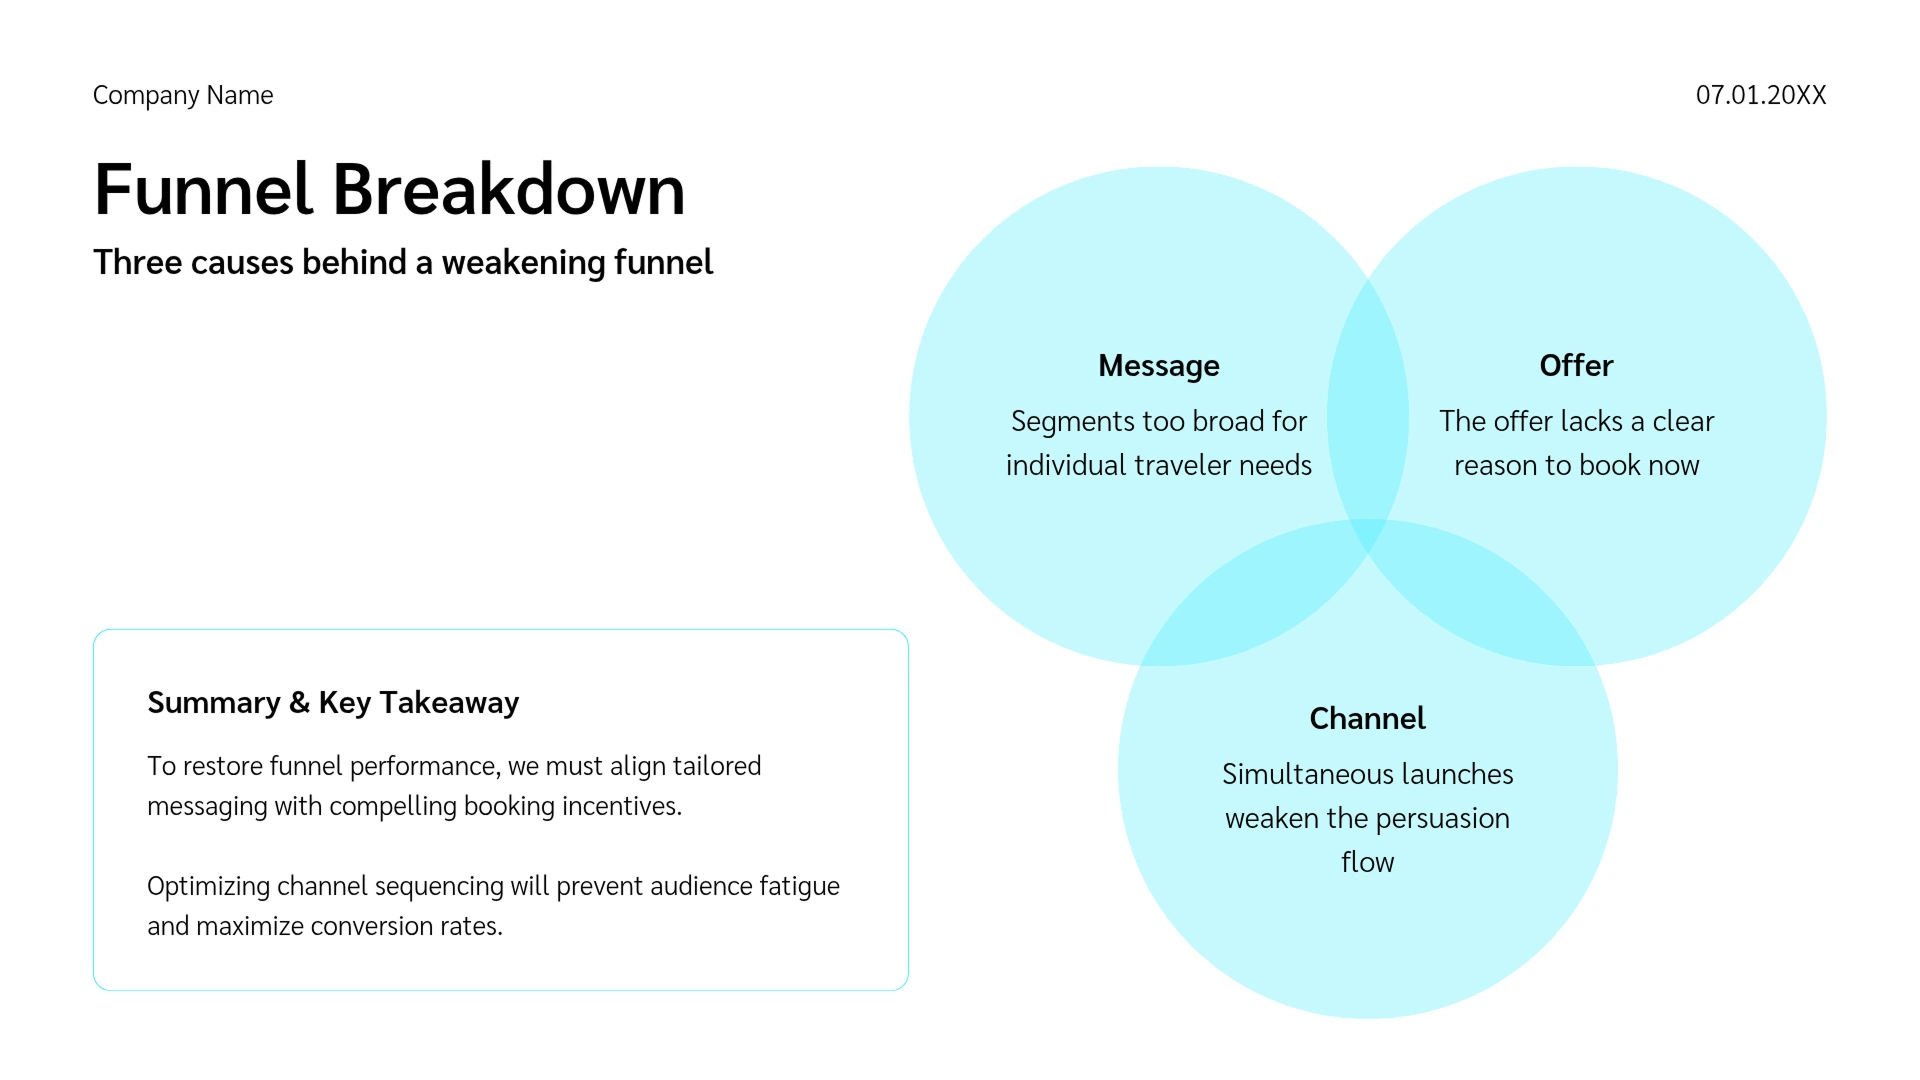
Miricanvas Venn diagram template titled "Funnel Breakdown," with three light-blue overlapping circles for Message, Offer, and Channel, plus a Summary & Key Takeaway box below.
Miricanvas Venn diagram template shown in a browser window, titled "Keywords Venn Diagram," with three overlapping circles for Core Value 1, 2, and 3 and their intersecting Common Values labeled around the diagram.
Miricanvas Venn diagram template with a TAM/SAM/SOM concentric-circle diagram showing $50 billion, $12 billion, and $60 million market tiers, paired with a breakdown table and calculation logic on the right.
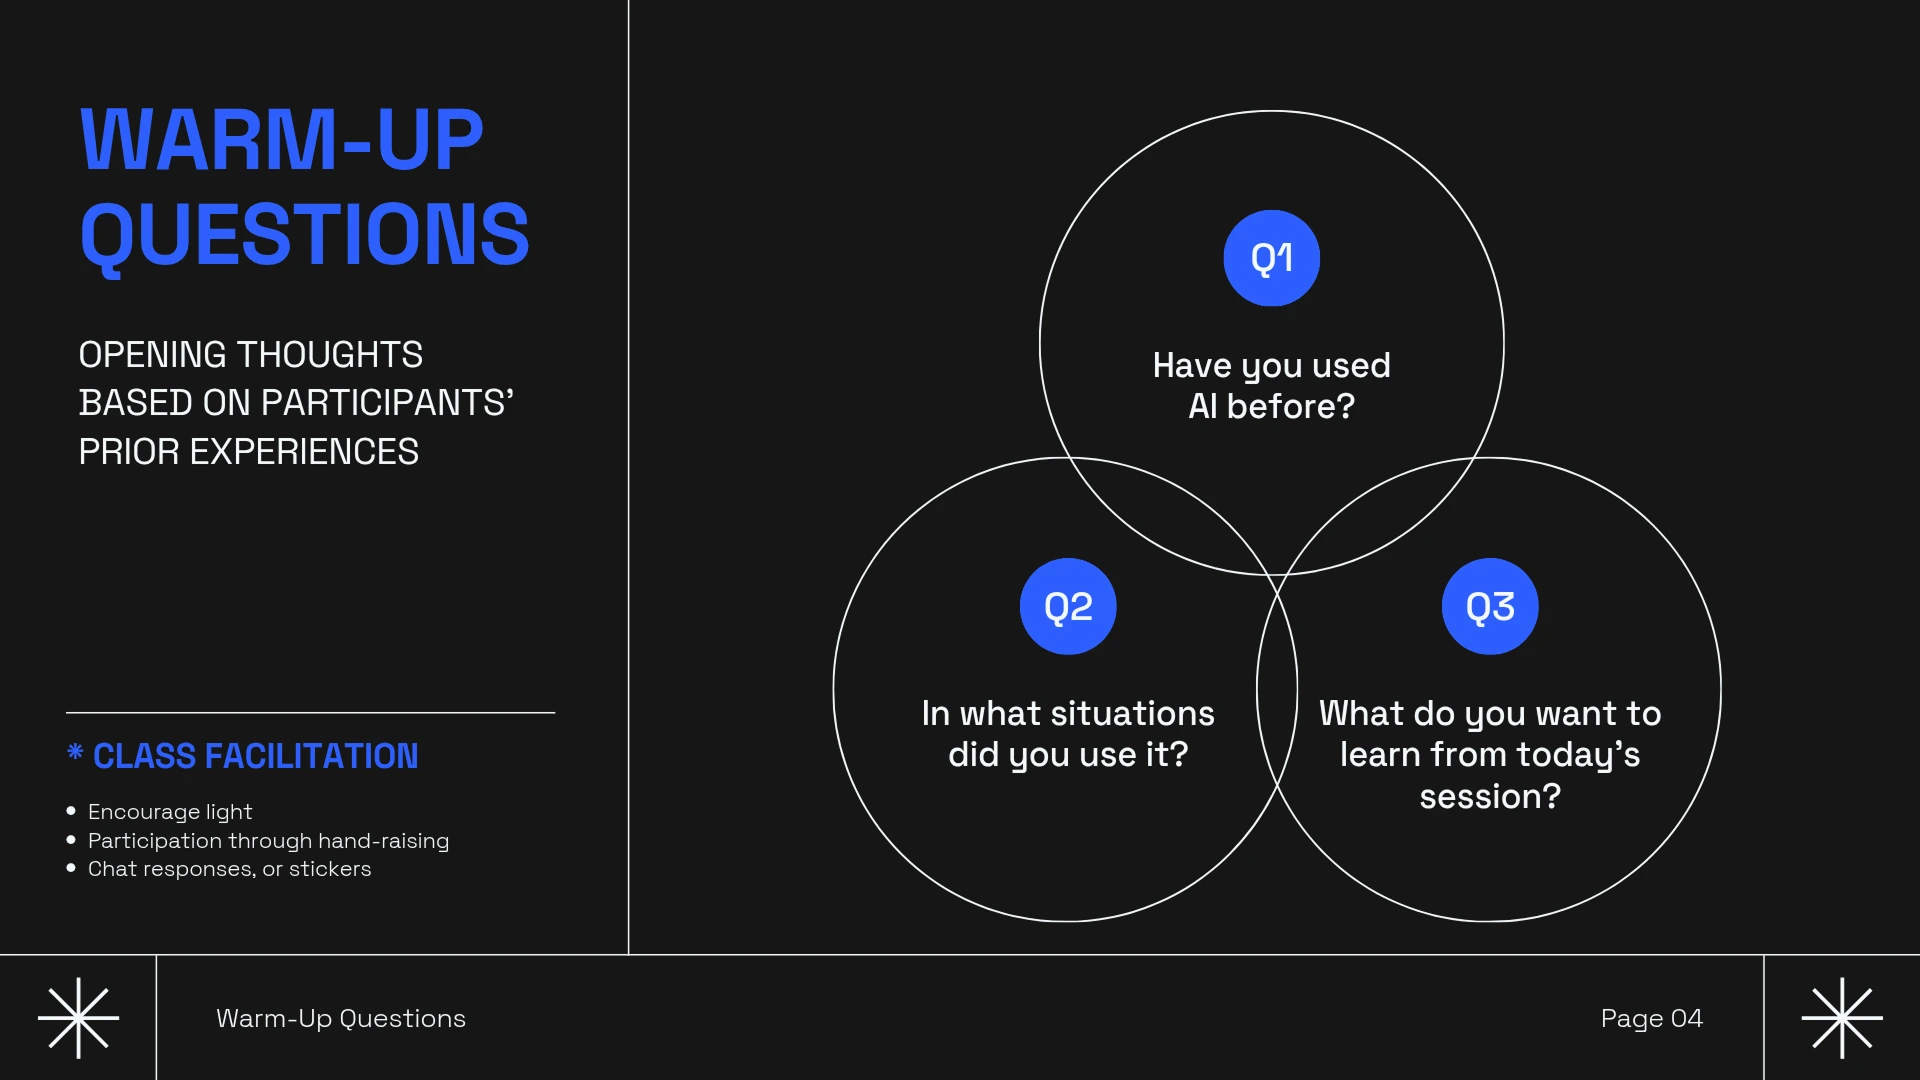
Dark Miricanvas Venn diagram template titled "Warm-Up Questions," with three overlapping circles for Q1, Q2, and Q3 discussion questions and facilitation notes on the left.

FAQ

When should I use a Venn diagram?

A Venn diagram helps when you need to lay several items side by side and sort out what they share and where they differ. Reach for one in situations like these:
- Comparing the features of two products or services to lay out their differences (marketers, planners).
- Visually explaining the relationship between two concepts or theories (students, instructors).
- Figuring out where the work of several teams or departments overlaps (professionals).
- Weighing several options to compare their shared conditions and individual ones at the same time.

How do 2, 3, and 4 circle Venn diagrams differ?

The more circles you add, the more items you can compare and the more intersection areas you get.
- 2 circle Venn diagram: The most basic setup for comparing two items. With a single, simple intersection, it's good for conveying what they share and how they differ clearly.
- 3 circle Venn diagram: Lets you compare three items at once. With three intersection areas, it can express the relationships between items more richly. It's often used to show the collaboration scope of three teams or the crossover of three conditions.
- 4 circle Venn diagram: Used for sorting out more complex relationships among four or more items. The circles are often arranged as ellipses, and since the relationships are complex, keeping your content concise matters.
For two or three items, a 2 or 3 circle layout reads more easily. For four or more, it's worth grouping items or considering another diagram type alongside it.

Is the MiriCanvas Venn diagram maker free?

Yes, you can make Venn diagrams on the free plan. You also get free access to over 50,000 templates and over 350,000 photos and graphics. If you want premium templates and AI features too, upgrade to the Pro plan. You can see the details on the Pricing Page.

Can I insert my finished Venn diagram into PowerPoint?

Yes. Once your Venn diagram is complete, export it as a PPTX file and open it directly in PowerPoint. If you'd prefer to build the entire presentation in MiriCanvas, you can also try the AI Presentation Maker.

Make Your Venn Diagram Now

Pick a design you like and just fill in your content. Once you refine the colors and layout, you'll have a Venn diagram that's ready for a presentation slide or report. Start free in MiriCanvas.

Make a Venn Diagram